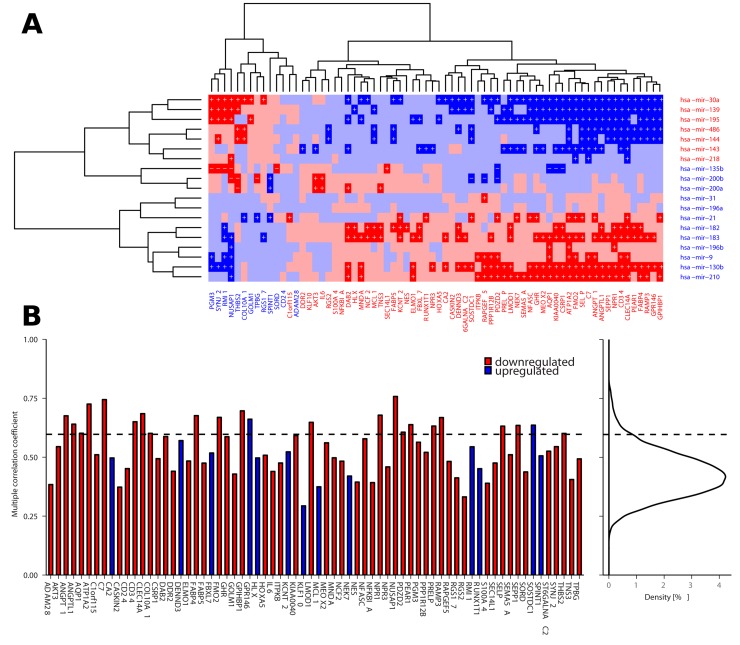
Figure 6. Correlation between deregulated miRNAs and paradoxical genes.
(A) Partial correlations between deregulated miRNAs and paradoxical genes as measured across TCGA LUAD data (red denotes negative correlation, blue denotes positive correlation, darker shade indicates significant correlations, p < 0.05). Plus signs denote partial correlation with causal explanation of gene deregulation, minus signs denote correlations that are significant but non-explanatory. (B) Barplot showing multiple correlations between paradoxical genes and en block deregulated miRNAs as calculated across TCGA LUAD data. Curve on the right depicts distribution of the same measure across all the genes in the TCGA LUAD data. Dashed line denotes 95th percentile of the distribution; there are 23 (32.9%) paradoxical genes whose multiple correlation coefficient falls among the top 5% of the highest values.

