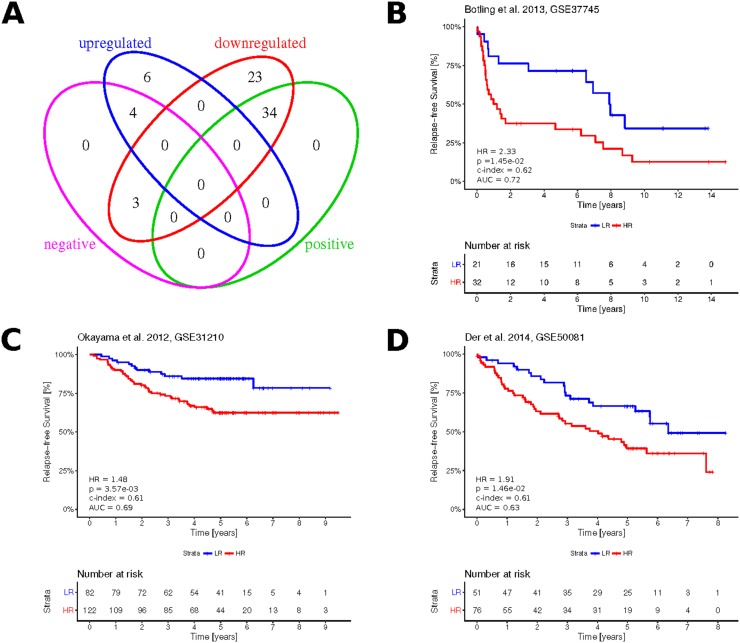
Figure 7. Clinical significance of the paradoxical genes.
(A) Venn diagram showing overlapping subsets of paradoxical genes with up-/ downregulated expression and subsets with positive (HR < 1, FDR < 0.05) and negative (HR > 1, FDR < 0.05) association with LUAD prognosis, as obtained from KMplot. (B–D) Kaplan-Meier plots showing survival curves in the three independent validation cohorts, as stratified based on the Cox proportional hazards calculated from paradoxical genes expression. Numbers in the bottom left, indicate resulting hazard ratio (HR), associated statistical significance of patient stratification (p), concordance index (c-index), area under ROC curve (AUC) calculated at five years.

