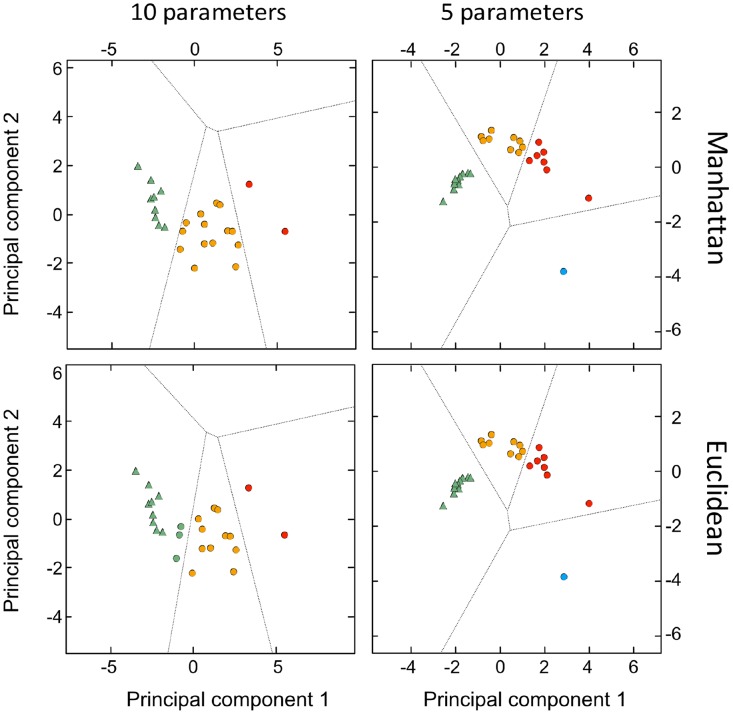
Figure 3. Principal component analysis (PCA)-based clustering by local optimization.
The two major principal components explain 88% of the total variance plotted for the 10 healthy individuals and 17 GB patients. The different groups are indicated by different colors (triangles for healthy individuals and circles for GB patients).

