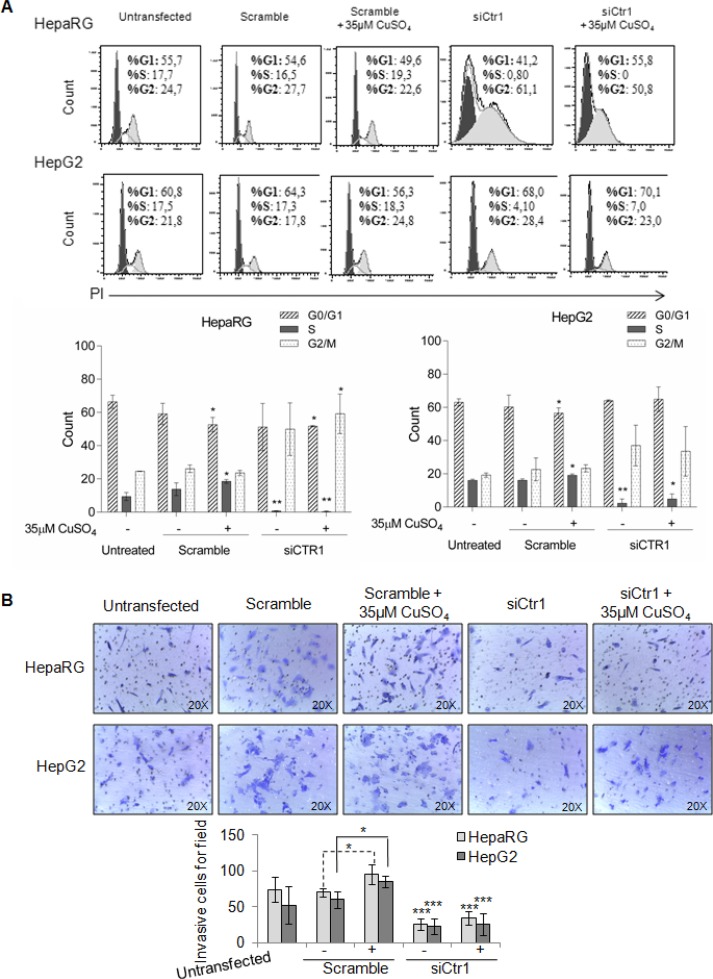
Figure 10. Biological effects of siCTR1.
(A) Top: Representative cell cycle distribution of un-trasfected, transfected, scramble and siCTR1 cells, in presence or not of 35 μM CuSO4 treatment. Cell cycle was done by Propidium Iodide (PI) staining and flow cytometry analysis. Bottom: Histograms reported the values as mean ± SD (*P < 0.05; **P < 0.01, respect to untreated cells; n = 3). (B) Transwell migration assay of HepaRG and HepG2 cells performed after 48 hrs in un-trasfected, transfected, scramble and siCTR1 cells, with or without CuSO4 treatment. Top: Representative microphotographs of crystal violet stained cells migrated to the bottom membrane of transwell (×20). Bottom: Quantification of the number of migratory cells, counted in 5 non-overlapping random fields of the membrane. Values are expressed as fold mean ± SD. (*P < 0.05 and **P < 0.01; n = 3).

