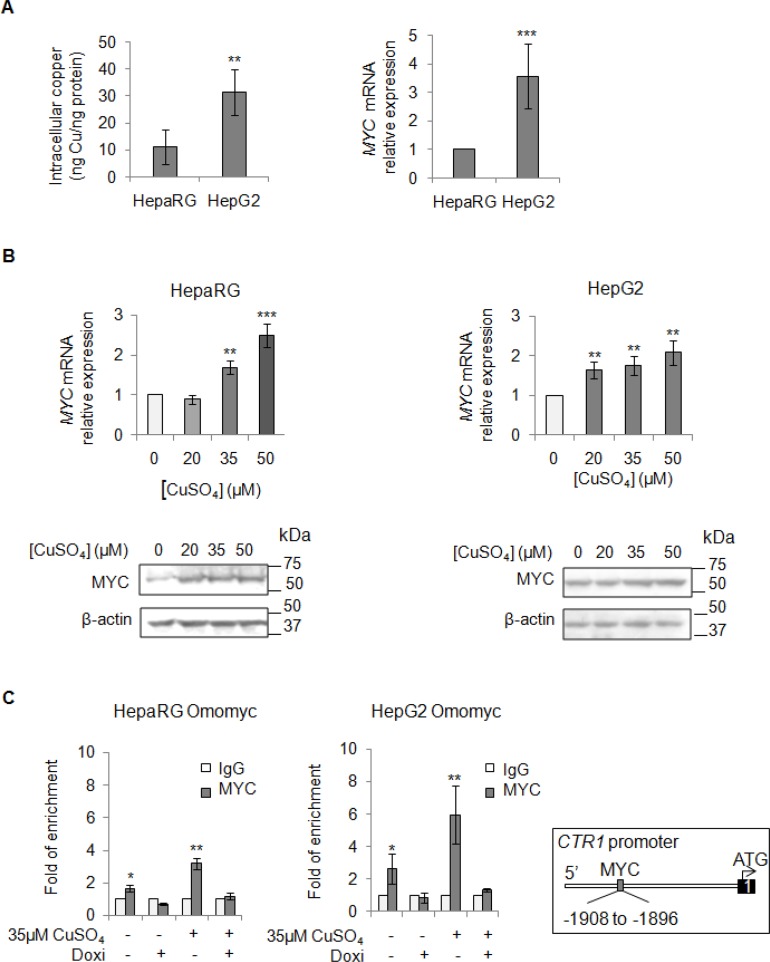
Figure 3. Direct interaction between MYC and CTR1.
(A) Left: Basal intracellular copper levels assayed by atomic absorption spectroscopy in HepaRg and HepG2 cells. Right: relative mRNA expression of MYC in HepG2 and HepaRG cells. Values are expressed as mean ± SD. (**P < 0.01 and ***P < 0.001; n = 5). (B) Relative mRNA expression and representative western blots of MYC in HepaRG (Left) and HepG2 (Right) cells after 20, 35 and 50 μM CuSO4 treatment (96 hrs). Values are expressed as fold mean ± SD. (**P < 0.01; n = 3). (C) MYC binding to the CTR1 promoter region, assayed by ChIP, after induction of Omomyc by doxycyclin (Doxi), before and after treatment with 35 μM CuSO4 (96 hrs). Values are expressed as fold mean ± SD of three independent experiments (*P < 0.05 and **P < 0.01). IgG was used as negative ChIP control. Right: Schematic representation of the MYC binding consensus sequences on the CTR1 promoter.

