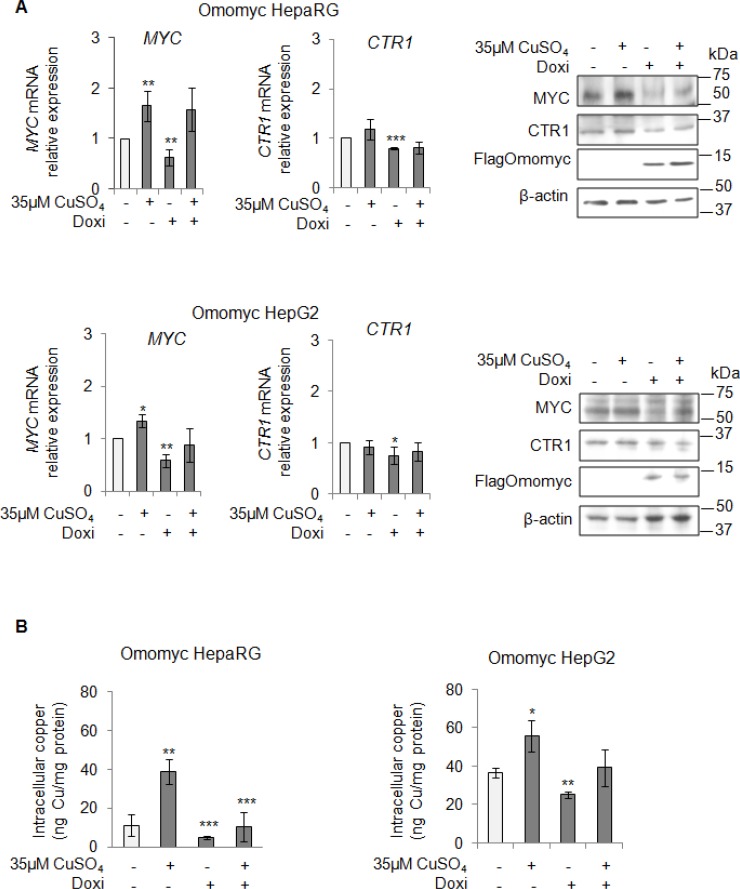
Figure 5. MYC modulates the intracellular copper homeostasis.
(A) Relative mRNA expression (Left) and representative western blots (Right) of MYC, CTR1 and FlagOmomyc in Omomyc HepaRG (Top) and HepG2 (Bottom) cells before and after induction of Omomyc by doxycyclin (Doxi), treated or not with 35 μM CuSO4 (96 hrs). Values are expressed as fold mean ± SD. (*P < 0.05; **P < 0.01 and ***P < 0.001; n = 3). (B) Intracellular copper levels in Omomyc HepaRG (Left) and HepG2 (Right) cells in the same experimental condition described above. Values are expressed as fold mean ± SD. (*P < 0.05; **P < 0.01 and ***P < 0.001; n = 3).

