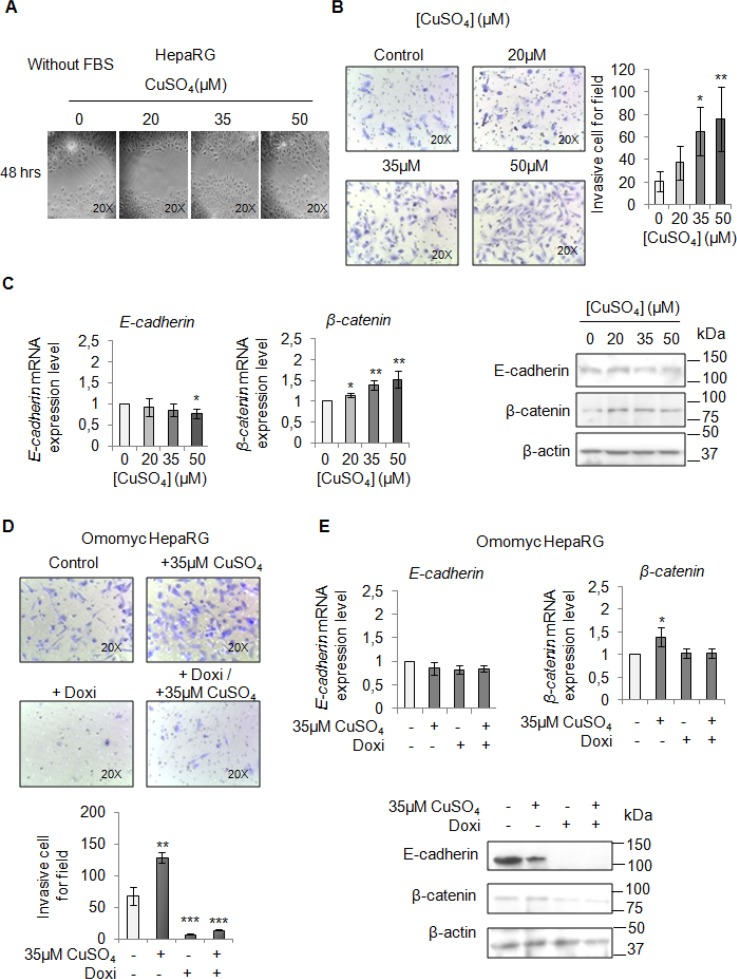
Figure 7. Copper promotes HepaRG invasion by MYC.
(A) Analysis of cell migration by a wound-healing assay in control and CuSO4 treated HepaRG cells. Representative microphotographs taken at 48 hrs post-wound (×20). (B) Transwell migration assay in HepaRG cells treated with copper for 48 hrs, in serum free medium. Left: Representative microphotographs of crystal violet stained cells migrated to the bottom membrane of transwell (×20). Right: Quantification of the number of migratory cells, that were counted in 5 non-overlapping random fields of the membrane. Values are expressed as fold mean ± SD. (*P < 0.05 and **P < 0.01; n = 3). (C) Relative mRNA expression (Left) and representative western blots (Right) of E-cadherin and β-catenin in HepaRG treated with CuSO4 up to 96 hrs. Values are expressed as fold mean ± SD. (*P < 0.05; n = 3). (D) Transwell migration assay in Omomyc HepaRG cells performed in a serum-supplemented medium, after induction of Omomyc by doxycyclin (Doxi), before and after treatment with 35 μM CuSO4 (48 hrs). Top: Representative microphotographs of crystal violet stained cells attached to the bottom membrane of a transwell (×20). Bottom: Quantification of the number of migratory cells using the transwell assay. Migratory cells were counted in five non-overlapping random fields of the membrane. Values are expressed as fold mean ± SD. (*P < 0.05 and ***P < 0.001; n = 3). (E) Relative mRNA expression (Top) and representative western blots (Bottom) of E-cadherin and β-catenin in Omomyc HepaRG cells treated or not with copper treatment (96 hrs). Values are expressed as fold mean ± SD (*P < 0.05; n = 3).

