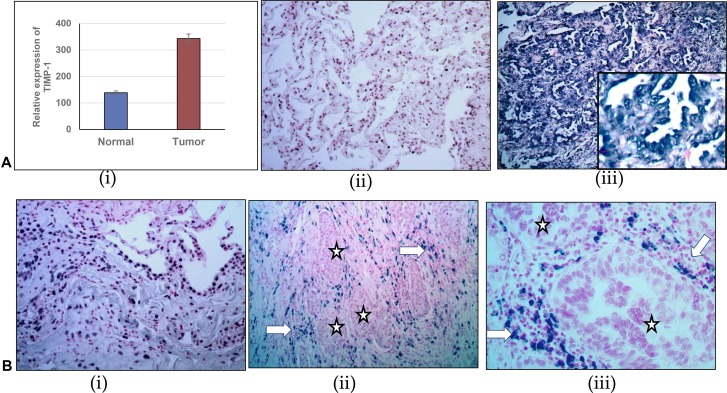
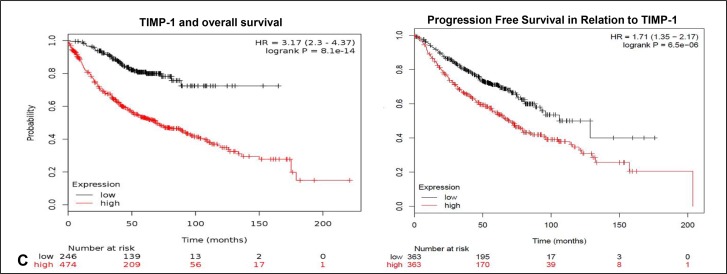
Figure 3. Comparison of relative expression of TIMP-1 and miR-125a-5p in normal adjacent lung tissue and lung adenocarcinoma.
(A) (i) Relative expression of TIMP-1 as detected by RT-PCR. (ii) and (iii) TIMP-1 expression detected by in-situ hybridization: (ii) Minimal TIMP-1 expression in normal adjacent tissue, 40× original magnification; (iii) High expression of TIMP-1 in representative tumor tissues 100× original magnification, inset- 400× original magnification. (B) (i): miR-125a-5p expression in normal adjacent tissue, detected by in-situ hybridization: 100× original magnification; (ii) and (iii) Almost total absence of miR-125a-5p expression in tumor cells (*) although some expression is seen within surrounding stromal region of the tumor (arrows) - 100× and 400× original magnification, respectively. (C) Kaplan Meier plots showing survival of patients in relation to TIMP-1 expression: To show the relationship of TIMP-1 with survival of patients we curated data manually, from expression arrays by KM Plotter, reference: PLoS One. 2013 Dec 18;8(12):e82241.54,675 Affymetrix probe set IDs (Affymetrix HG-U133A, HG-U133 Plus 2.0 and HG-U133A 2.0) and 70,632 gene symbols.


