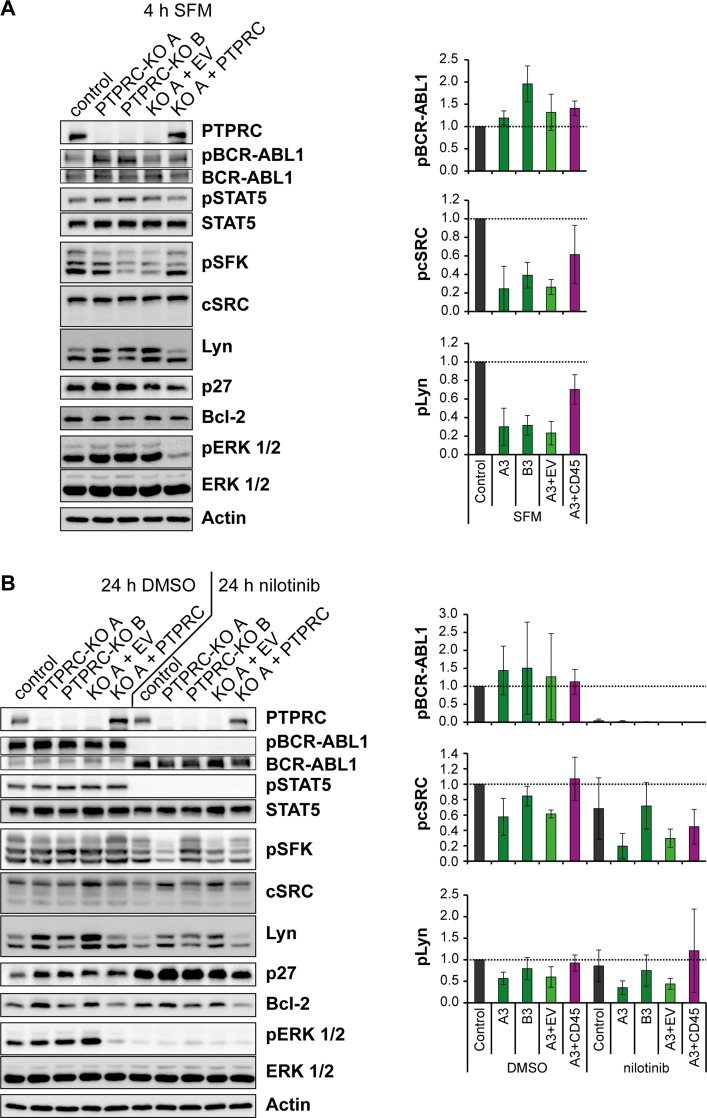
Figure 6. Nilotinib treatment and PTPRC deficiency affect aspects of BCR-ABL1 signal transduction in the same direction.
K562 cells with PTPRC knockout and respective PTPRC re-expressing cells were starved from serum for 4h (SFM) (A), or treated with nilotinib (1 μM, 24 h) or DMSO in presence of 10 % FCS (B). Cell lysates were prepared and subjected to SDS-PAGE and immunoblotting with the indicated antibodies. Total protein was detected after stripping off the respective phospho-specific antibodies. Representative blots of n = 3 independent experiments are shown (left). Quantification of blots of n = 3 independent experiments is shown on the right: the phospho-signal was divided by the respective total protein signal. The signals of engineered PTPRC KO and re-expressing cells are reported relative to the control cell signals of each experiment. Shown is the mean relative intensity of n = 3 independent experiments +/− standard deviation (SD). Quantifications of pSTAT5, p27, Bcl-2, and pERK 1/2 are depicted in Supplementary Figure 5.

