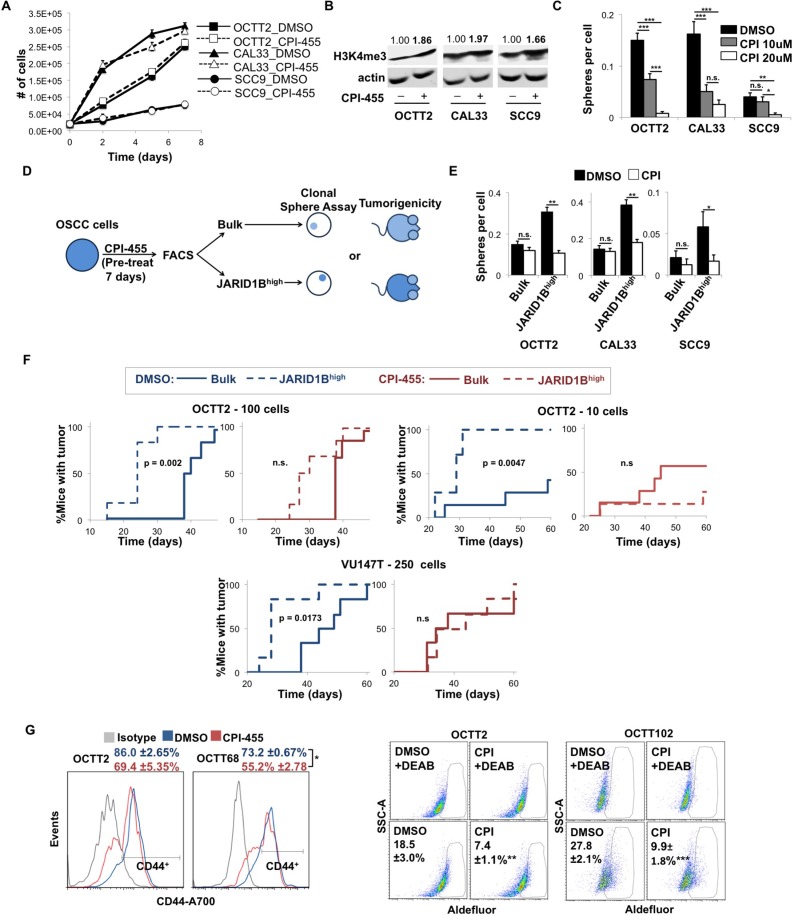
Figure 1. CPI-455 attenuates the stem cell-like features of OSCC cells.
(A) Cell growth over time of OSCC cells treated with CPI-455 (20 μM). (B) WB showing H3K4me3 levels in cell lines treated for 5 days with CPI-455 (20 μM). Values are H3K4me3 band densities normalized to actin. (C) Clonal sphere formation during continuous CPI-455 (CPI) treatment. *p < 0.05, **p < 0.001, ***p < 0.0001 (D) Schematic of CPI-455 pretreatment protocol. (E) Sphere formation by JARID1Bhigh vs. bulk OSCC cells after 7 days of pre-treatment with CPI-455 (20 μM). *p < 0.05, **p < 0.0001 (F) Xenograft formation by JARID1Bhigh vs. bulk OCTT2 (left: 100 cells/mouse, n = 6, middle: 10 cells/mouse, n = 7) or VU147T (right: 250 cells/mouse, n = 6) cells pre-treated for 7 days with CPI-455 (20 μM, red) or DMSO (blue). p-values are unadjusted. (G) Representative FC plots of CD44 (left) and Aldefluor (right) positive cells in primary cultures of PDXs after 5 days CPI-455 treatment (20 μM). Aldefluor positivity was defined as fluorescence above background in presence of the ALDH inhibitor DEAB. *p < 0.05, **p < 0.025, ***p < 0.01.

