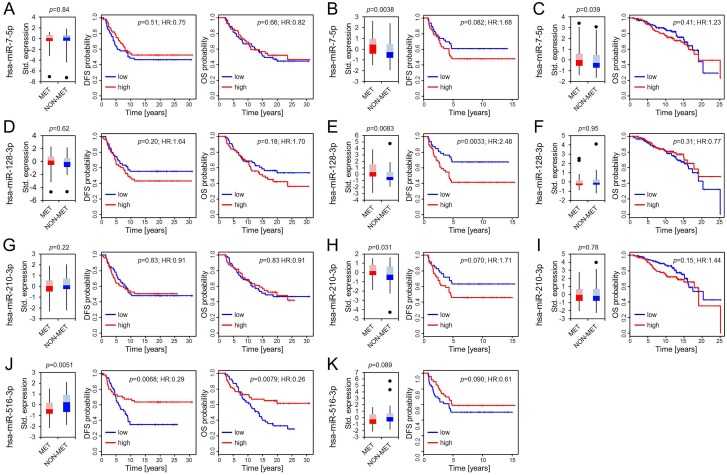
Figure 2. Differential expression of hsa-miR-7-5p, hsa-miR-128-3p, hsa-miR-210-3p and hsa-miR-516-3p.
Boxplots present differences in expression patterns between patients who developed later metastasis (MET) and those who did not (NON-MET) from the OUH, the D’Aiuto et al. and the Metabric cohort (panels from left to right). Whiskers correspond to the upper and lower 25% range, data points deviating more than 3*STDEV from the mean are displayed as dots. Lighter colors indicate the 50–75 percentile range while darker colors indicate the 25–50 percentile range of miRs expressed in MET (red) and NON-MET (blue). Significance was calculated using a paired Student’s T-test for the OUH cohort (A, D, G, J) and an unpaired Student’s T-test for the D’Aiuto et al. (B, E, H, K) and Metabric cohort (C, F, I). Kaplan Meier plots display disease free (DFS) and overall survival (OS) along with the univariate COX-PH regression significance levels.

