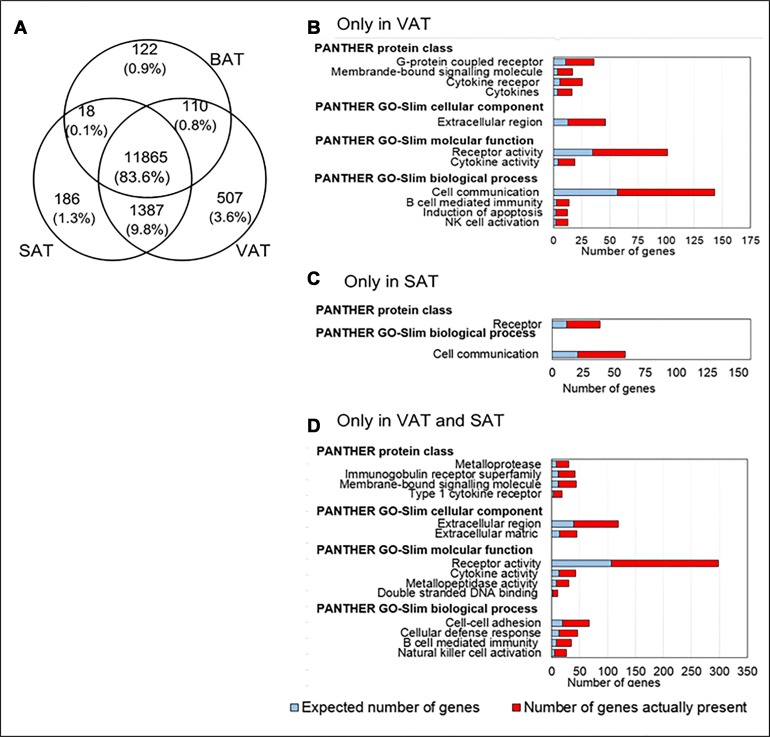
Figure 1. Analysis of co-expressed and tissue-specific transcripts in HFD fed mice.
(A) Venn diagram showing transcripts expressed with RPKM of ≥ 0.3 in BAT, SAT and VAT. Each depot is represented by a circle in the Venn diagram. The numbers in the various regions of the three overlapping circles indicate either unique or co-expressed transcripts among pairs of depots and among all three depots. The top significant and over represented Gene Ontology categories which include molecular functions, cellular components, biological processes, and protein classes for tissue specific and co-expressed transcripts are shown (B) specific to VAT, (C) specific to SAT, and (D) co-expressed in VAT and SAT are shown. The expected number of genes is based on the reference list.

