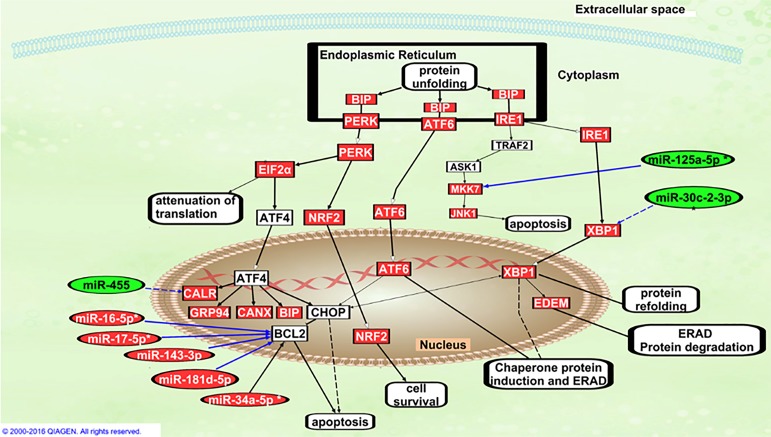
Figure 3. Differentially expressed genes and miRNAs related to ER Stress and Unfolded Protein Response pathway in the VAT/BAT comparison of HFD fed mice using Ingenuity Pathway Analysis (IPA®).
Genes and miRNAs with higher expression in VAT than in BAT are indicated in red, while those with lower expression in VAT than in BAT are in green. Complete lines indicate direct relationships and dashed lines indicate indirect relationships.

