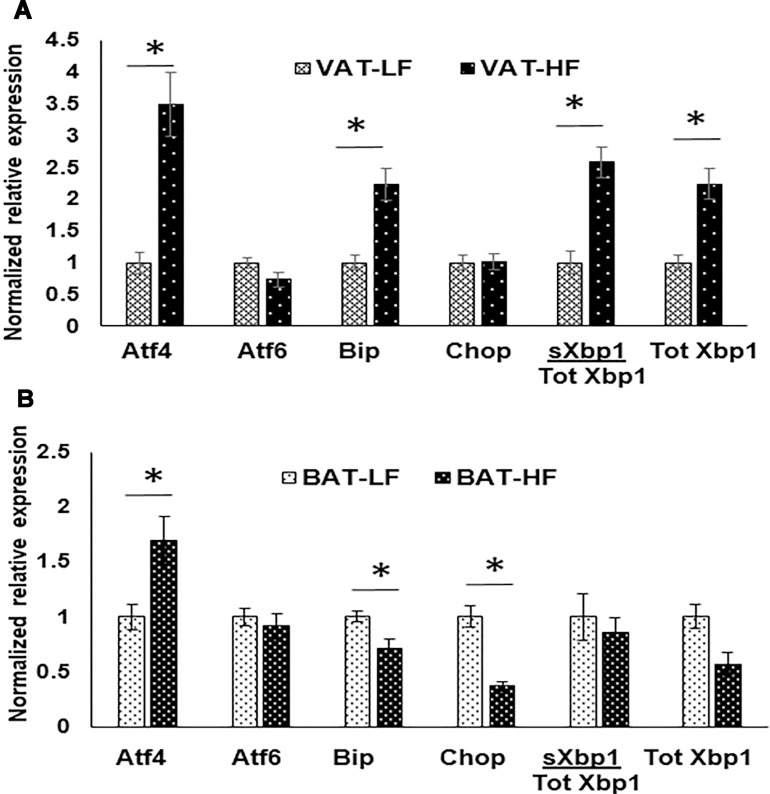
Figure 5. Normalized expression of ER stress markers in VAT and BAT with HFD vs LFD mice comparison using RT-qPCR.
(A) in VAT (B) in BAT *indicates p value < 0.05, n = 3 per group. 18S was used as the house keeping gene for normalization. BAT- HF (BAT from mice fed on a HFD), BAT-LF (BAT from mice fed on a LFD), VAT-HF (VAT from mice fed on a HFD), VAT-LF (VAT from mice fed on a LFD).

