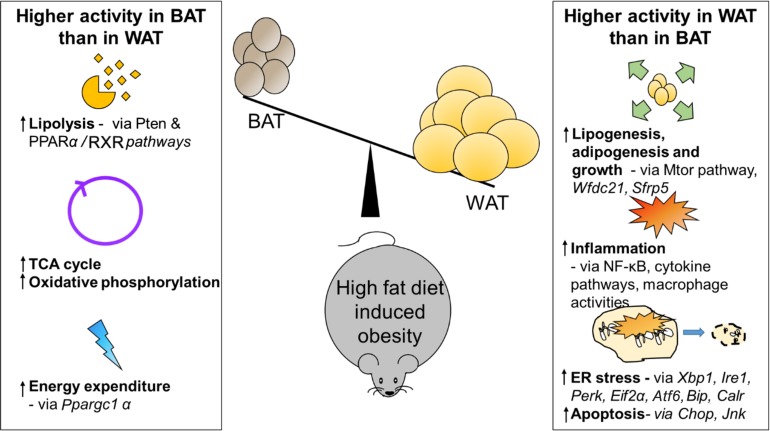
Figure 7. Comparison of white and brown adipose tissue in high fat diet induced obesity in mice-summary of the findings.
As a summation of the results from combined analysis of RNA-Seq and miRNA profiling, the differential expression or activity of pathways and genes in brown (BAT) and white (WAT) adipose tissue in high fat fed obese mice are shown here. Some pathways and genes are quoted as examples.

