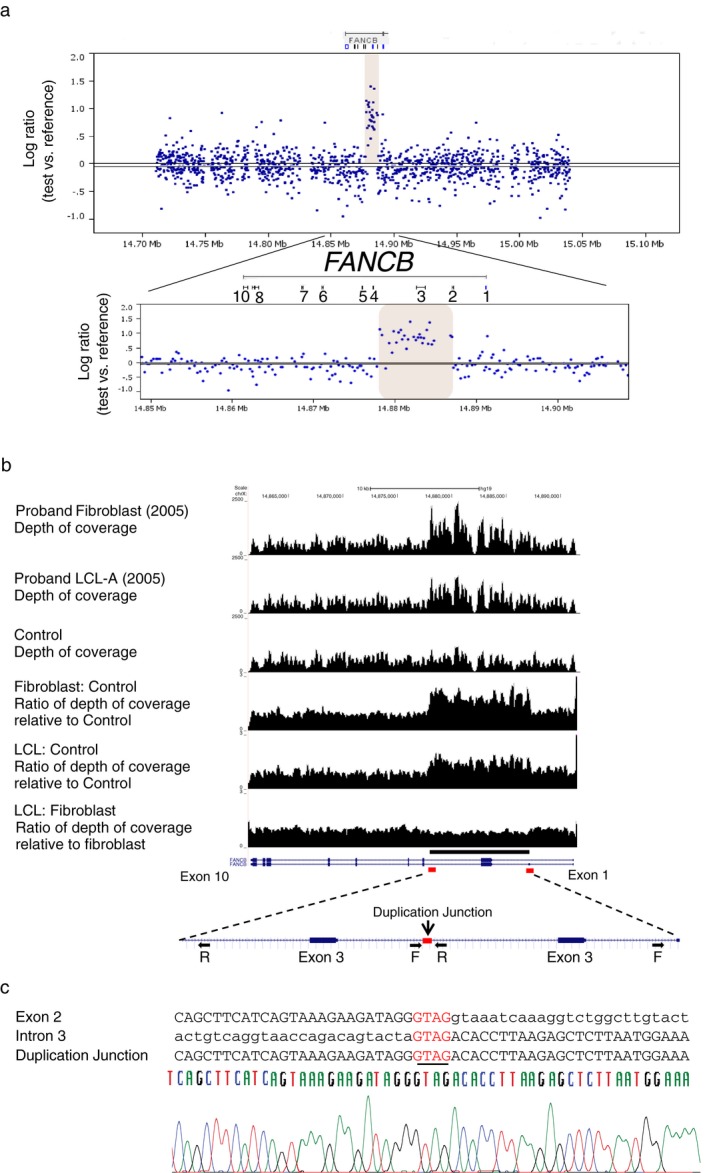
Figure 2.

Detection and sequencing of duplication breakpoint. (a) ArrayCGH of DNA from proband's fibroblasts. Differential hybridization data obtained from the hybridization of genomic DNA from proband fibroblasts against a male reference DNA on a custom designed CGH array. The Log2 ratio of the signal intensity from test versus reference DNA is shown on the y‐axis, and X‐ axis shows the entire FANCB gene region. Increased signal intensity from proband DNA (expanded at the bottom), around exon 3 indicates duplication of this ~10 kb region in FANCB (NM_001018113.2). (b) Targeted capture and next‐gen sequencing (NGS) of the FANCB gene region. Targeted capture/sequencing of genomic DNA shows increased number of reads for the duplicated region (chrX:14877976‐14887129 or chrX:14877972‐14887133) in the proband fibroblast and LCL‐A‐2005, compared to a control DNA (top 3 tracks). The ratio of depth of coverage (bottom 3 tracks) confirms the duplicated region. Discordant reads at the region of duplication showed a tandem intragenic duplication of 9154 bp in FANCB, head to tail, in the same orientation and is expanded at the bottom of the hg tracks for FANCB. The red rectangular boxes indicate a shared homology of four bases (GTAG) at both ends of the breakpoint region, but only one in the duplicated region. (c) Sequence alignment of the FANCB duplication junction. The sequence alignment of the breakpoint junction, along with the sequence of the exon 2 and intron 3, the two ends of the duplication are shown here. The sequence at the junction suggested a microhomology‐mediated duplication event leading to the disease
