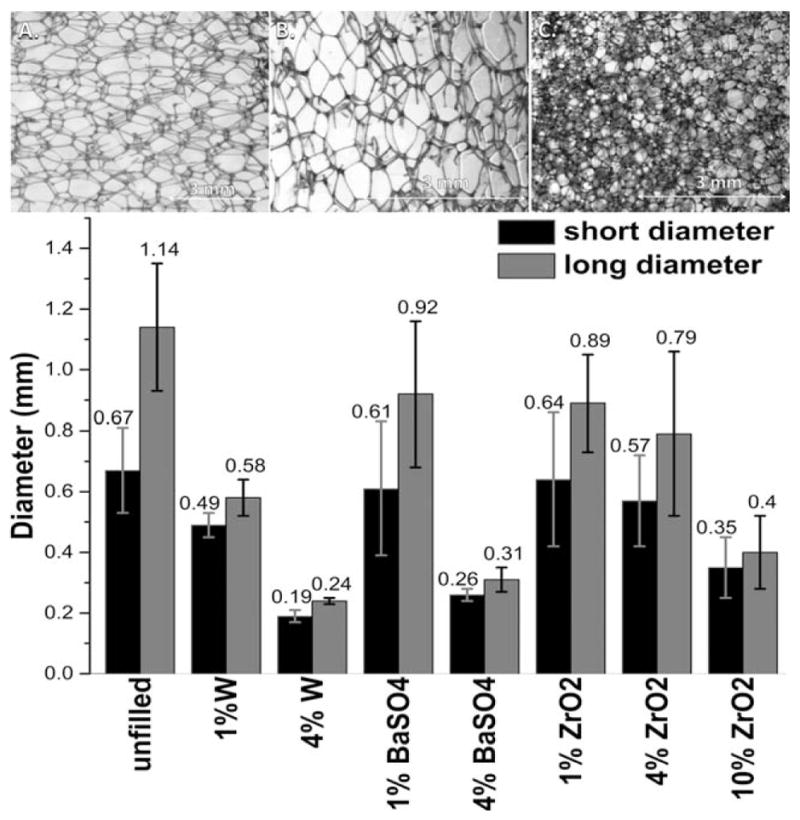
Figure 1.

Above, confocal microscopy of (A) unfilled foam pores, (B) 1% W and (C) 4% W filled foam pores. Below, the average foam pore diameter based upon loading species and concentration. The pores were treated as two-dimensional entities, with two perpendicular diameters of the pores being used to calculate the diameter of the pore. The average diameter is shown above the error bars (n = 20).
