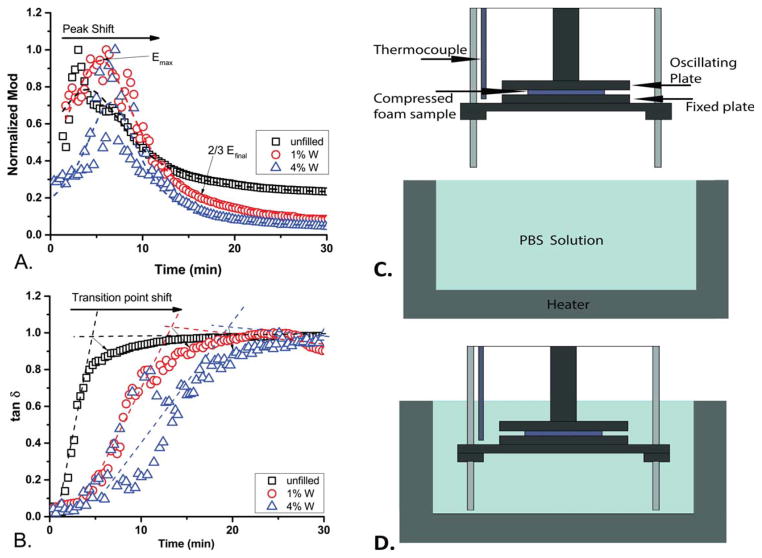
Figure 2.
The immersion DMA over time representative curves, showing the data for the W series, while immersed in 50°C PBS solution (A. normalized modulus, B. tan δ) (n = 3). The experimental apparatus is shown before immersion (C) and when immersed (D). [Color figure can be viewed in the online issue, which is available at wileyonlinelibrary.com.]

