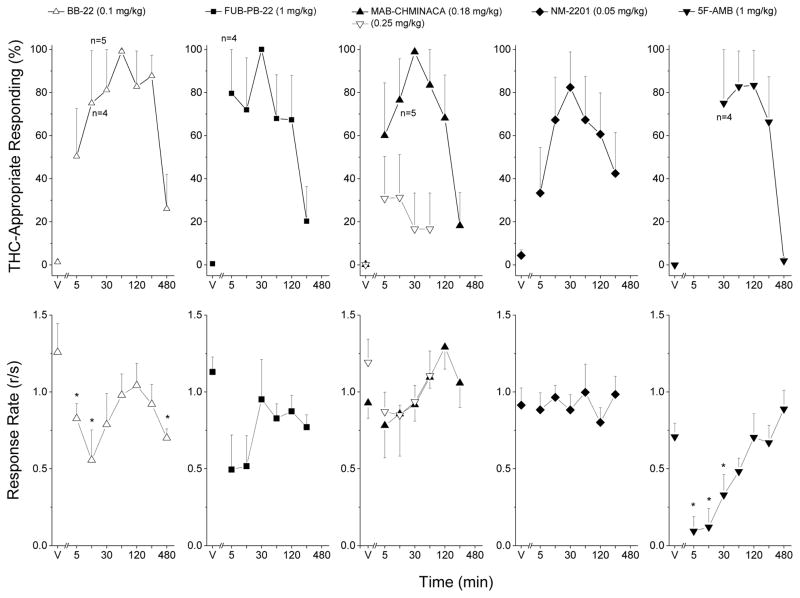
Fig. 3.
Substitution for the discriminative stimulus effects of Δ9-THC: Time-course. Upper panels show mean percentage of total responses (± standard error of the mean) made on the drug-appropriate lever as a function of time, for doses with three or more rats completing the first fixed ratio. Bottom panels show rate of responding (± standard error of the mean) in responses per second (r/s). Cannabinoids, n=6 except where shown. V indicates the vehicle control values. * indicates response rate different from vehicle control (p < 0.05).

