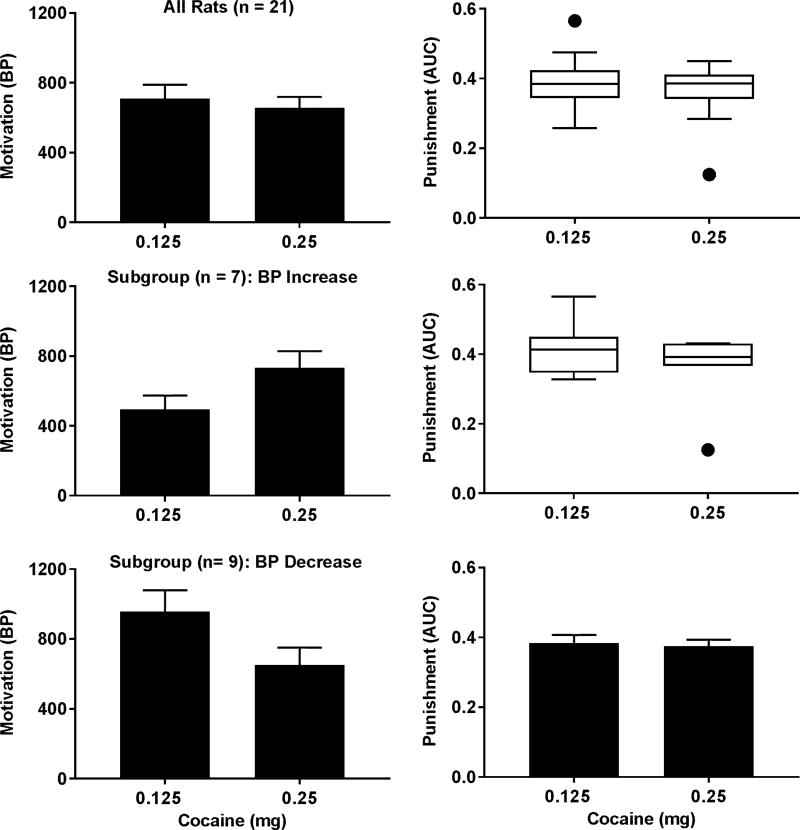
Figure 7.
Impact of different motivational levels for cocaine on the punishment sensitivity. Upper left panel: bar graph showing no change in the BPs at the group level (paired t test, p = 0.44). Upper right panel: box and whisker plot showing no significant change in the AUCs at the group level (Wilcoxon signed-rank test, p = 0.51). Middle left panel: bar graph showing an increase in the BPs of the BP-increasing subgroup (paired t test, p < 0.01). Middle right panel: box and whisker plot showing no significant change in the AUCs within the BP-increase subgroup (Wilcoxon signed-rank test, p = 0.38). Lower left panel: bar graph showing a decrease in the BPs of the BP-decreasing subgroup (paired t test, p < 0.01). Lower right panel: bar graph showing no significant change in the AUCs within the BP-decrease subgroup (paired t test, p = 0.72). See Figure 3 for other details.

