
Fig 2.
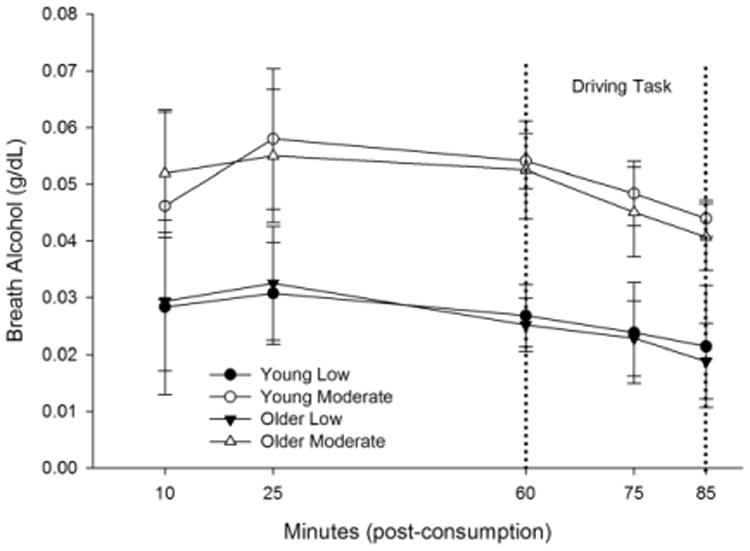
BrAC curves for young and older low and moderate dose groups. There were no main or interactive effects of age. Dashed lines indicate the start and end of the simulated driving task. Error bars depict standard deviation.
Official websites use .gov
A
.gov website belongs to an official
government organization in the United States.
Secure .gov websites use HTTPS
A lock (
) or https:// means you've safely
connected to the .gov website. Share sensitive
information only on official, secure websites.
BrAC curves for young and older low and moderate dose groups. There were no main or interactive effects of age. Dashed lines indicate the start and end of the simulated driving task. Error bars depict standard deviation.