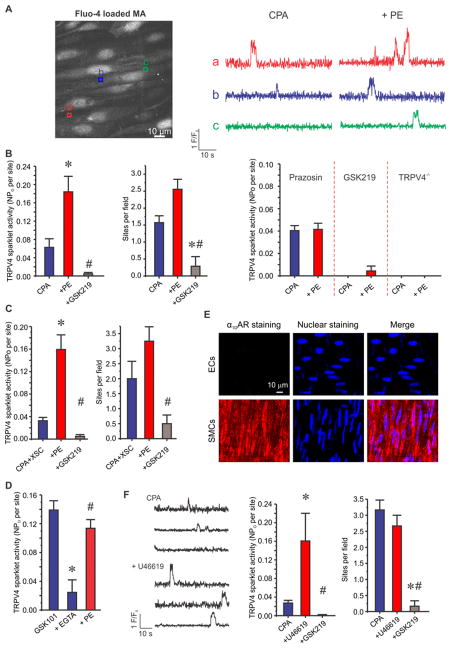
Figure 2. SMC GqPCR activation stimulates endothelial TRPV4 sparklets independent of IP3R-mediated Ca2+ release in MAs loaded with fluo-4.
Experiments were performed in the presence of CPA (20 μM). (A) Left, a greyscale image of a field of view with ~15 ECs from C57BL6/J mouse. Square boxes represent the regions of interest (ROIs) placed at TRPV4 Ca2+ sparklet sites. Right, representative F/F0 traces generated using the ROIs on the grayscale image display TRPV4 sparklets before and after the addition of PE (10 μM). (B) Left, averaged basal or PE-induced (10 μM) endothelial TRPV4 sparklet activity before or after GSK219 addition (100 nM, n=9) * # p<0.05 vs. CPA or PE, respectively. Right, summarized effect of PE on TRPV4 sparklet activity in the presence of prazosin (an α1AR antagonist, 500 nM), GSK219, or in MAs from TRPV4−/− mice (n=8). (C) Averaged TRPV4 sparklet activity in the absence or presence of XSC, +PE, or +GSK219 (n=4). XSC represents xestospongin C (a potent IP3R inhibitor, 3 μM). * # p<0.05 vs. CPA+XSC or PE, respectively. (D) Averaged TRPV4 sparklet activity in the presence of GSK101 (a TRPV4 channel agonist; 10 nM) alone, EGTA-AM (a cell permeable Ca2+ chelator; 5 μM), and PE (10 μM) (n=5). (E) Representative images for α1DAR immunostaining (left), nuclear staining with DAPI (middle), and merged staining (right) in the ECs (top) and SMCs (bottom) from an en face MA. The immunostaining image is representative of n=15 separate fields. (F) Left, representative F/F0 traces display TRPV4 sparklets before and after the addition of U46619 (1 μM). Right, averaged TRPV4 sparklet activity in the presence of CPA, +U46619, or +GSK219 (n=6). U46619 is a thromboxane receptor agonist (1 μM). * # p<0.05 vs. CPA or U46619, respectively. TRPV4 sparklet activity is expressed as NPO per site and number of sparklet sites per field (Figure 2B–D, F). N represents the number of channels at a site and PO is the open state probability of the channels. Data are presented as mean ± SEM.

