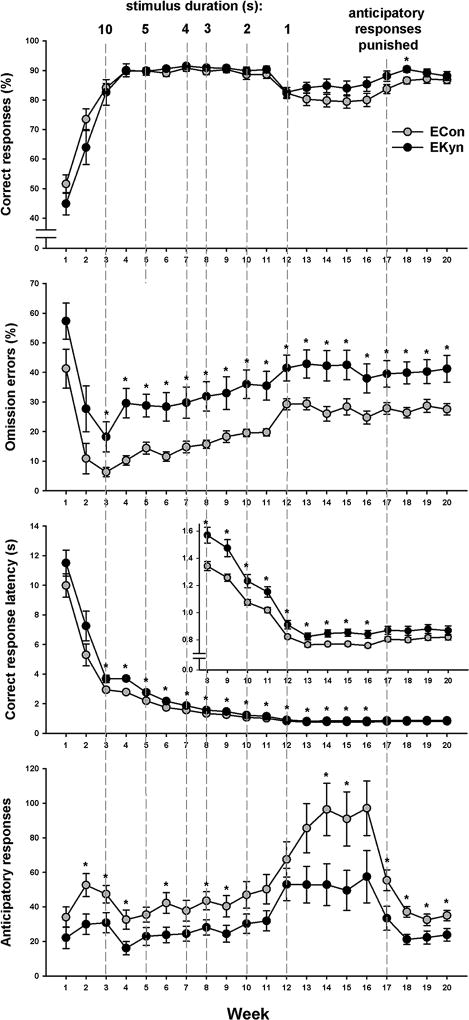
Fig. 2.
Average (± SEM) performance of rats embryonically exposed to kynurenine (EKyn; N=20) and control rats (ECon; N=20) in each of the 20 weeks of training. The vertical dashed lines demarcate weeks in which a shorter stimulus duration was introduced; the new stimulus duration is indicated on top. Insert: larger scale for the weeks indicated, to allow improved visualization of group differences in response latency. * P<0.05 in independent-samples t-test.

