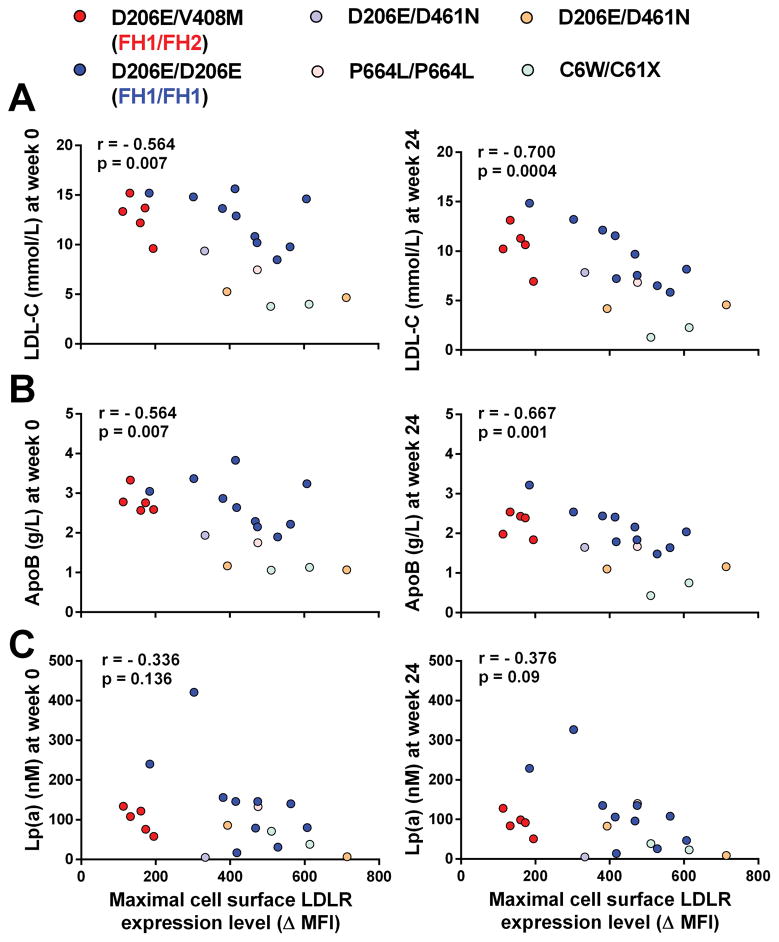
Figure 2. Association between the maximal levels of LDLR cell surface expression in lymphocytes and the concentrations of (A) LDL-C, (B) ApoB and (C) Lp(a) measured in the plasma of HoFH patients before (week 0 – left panels) and after (week 24 – right panels) treatment with evolocumab 420mg Q2W.
Spearman correlation coefficients (r) and significance (p) values are indicated.

