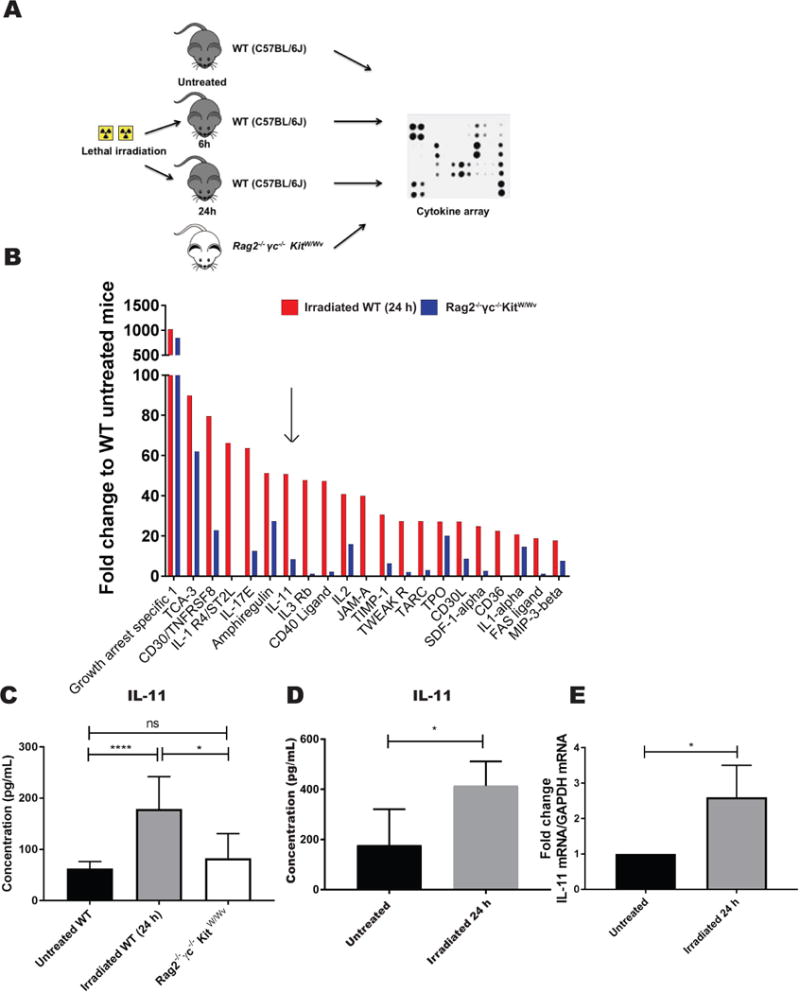
Figure 4. IL-11 is upregulated in the bone marrow of irradiated recipients, but not in Rag2 −/− γc−/− KitW/Wv mice.

A) Schema of the experimental design for the cytokine array analysis. Bone marrow supernatant was isolated from C57Bl/6J mice either untreated or treated with lethal doses of irradiation (6 and 24 h after irradiation) and compared to the bone marrow supernatant isolated from Rag2 −/− γc−/−KitW/Wv mice. B) Bar graph represents the fold change to WT untreated mice of cytokines upregulated in the BM supernatant of irradiated mice (only the top 20 hits ranked by the highest expression at 24 h after irradiation are shown), and the relative levels in Rag2 −/− γc−/−KitW/Wv mice. Arrow points to IL-11. C) IL-11 levels were quantified by ELISA on BM supernatants isolated from irradiated and non-irradiated WT mice at the indicated time point, and Rag2 −/− γc−/−KitW/Wv. Bar graphs represent average values from 5-8 mice per condition. Error bars represent standard deviation (SD). D) IL-11 was measured by ELISA in supernatants harvested from primary stromal cell cultures untreated or 24 h after irradiation. Bar graphs represent mean IL-11 concentration values from 4-7 independent cultures. Error bars represent standard deviation (SD). E) IL-11 mRNA levels were quantified by qPCR in MS-5 stromal cell lines at baseline (untreated) and 24 h after irradiation. Bar graphs represent mean values from 4 biological replicates. Values are presented as fold change to untreated. Error bars represent standard deviation (SD). *P <05; ****P < .0001
