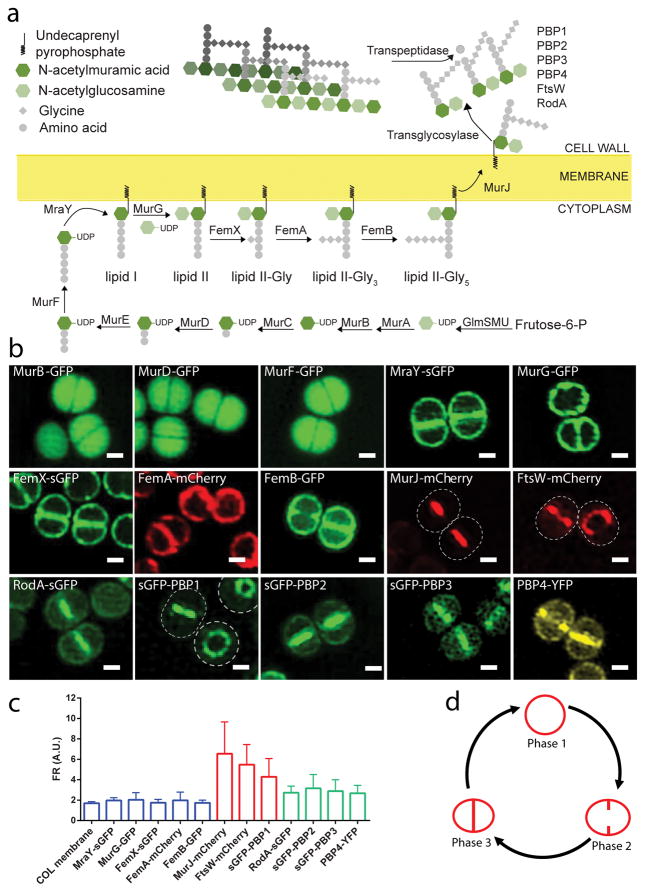
Figure 1. Localisation of PG synthesis proteins during division of Staphylococcus aureus.
a, Scheme of the peptidoglycan synthesis pathway in S. aureus. b, Structured Illumination Microscopy (SIM) images of S. aureus cells expressing fluorescent derivatives of PG synthesis proteins. Scale bars, 0.5 μm. Images are representative of three biological replicates. c, Fluorescence ratios (FR) between fluorescence signal at the septum versus the peripheral membrane measured in cells with a complete septum (Phase 3). Blue bars: membrane proteins with FR~2, similar to Nile Red staining of COL membrane, expected as the septum contains two membranes versus one in the cell periphery. Green bars: septal enriched proteins with 2.5<FR<3.5. Red bars: septal proteins with FR>4. Data are represented as column graphs where the height of the column is the mean and whiskers are standard deviation. N, from left to right: 439, 533, 516, 513, 512, 622, 503, 517, 503, 689, 1321, 488, 516 cells. d, Scheme of the S. aureus cell cycle. Phase 1 cells have not initiated septum synthesis; Phase 2 cells are undergoing septum synthesis; Phase 3 cells have a complete septum undergoing maturation in preparation for splitting.

