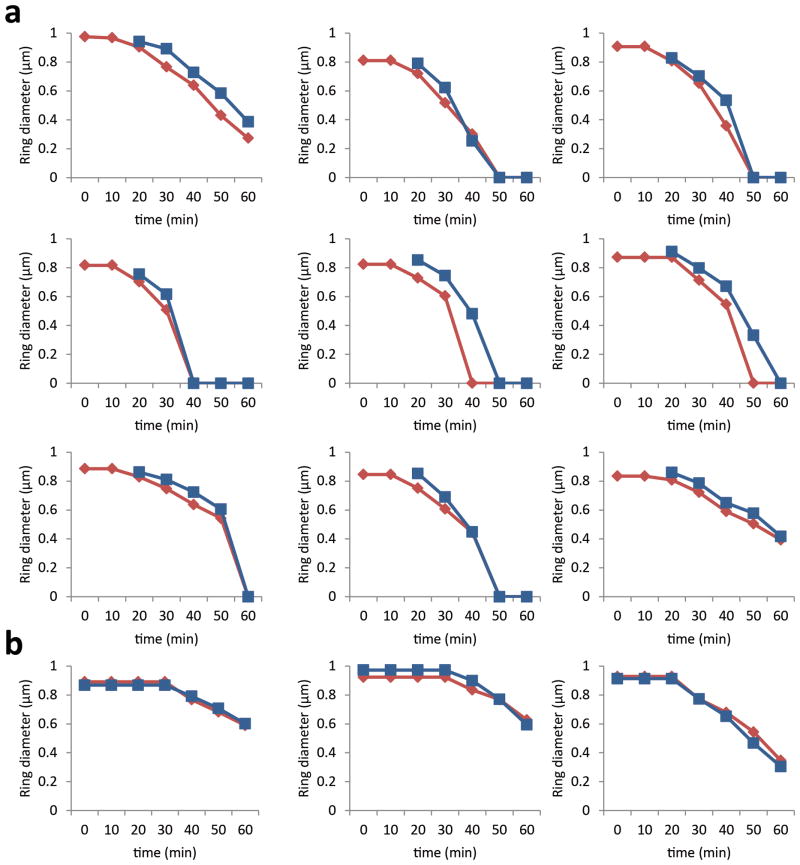
Extended Data Figure 9. Additional graphs of FtsZ, MurJ and FtsW ring diameter during constriction.
a, Graphs of ring diameters of FtsZ-mCherry (red lines) and MurJ-sGFP (blue lines) in strain ColJgZm. SIM images were taken every 10 min and measurements of ring diameter of FtsZ-mCherry and MurJ-sGFP were performed in cells where MurJ-sGFP signal first appeared after 20 minutes. b, Graphs of ring diameters of FtsZ-mCherry (red lines) and FtsW-sGFP (blue lines) in strain ColWgZm. SIM images were taken every 10 min and measurements of ring diameter of FtsZ-mCherry and FtsW-sGFP were performed in cells where FtsZ-mCherry ring diameter was constant for at least the first 20 minutes.

