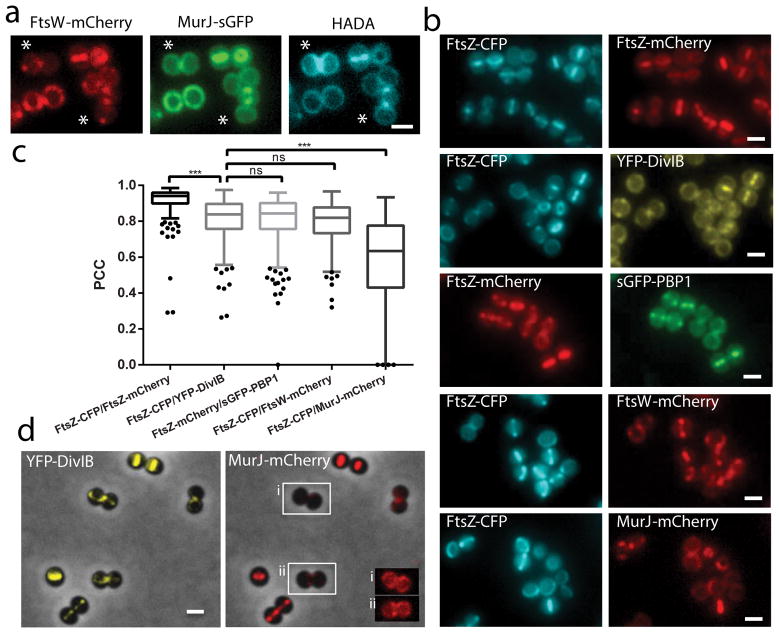
Figure 2. Hierarchy of arrival of key PG synthesis proteins to the divisome.
a, PG synthesis in strain ColWJ was labelled with HADA. Asterisks show cell with septal FtsW and peripheral MurJ and HADA labelling. b, Fluorescence microscopy images of strains (from top) ColZZ (positive control), ColZIB, ColP1Z, ColWZ and ColJZ. c, Pearson’s correlation coefficient (PCC) for pairs of fluorescent proteins expressed in the same strain. PCC=1 would indicate perfect colocalisation. Negative PCC values are represented as 0. From left to right, N=312, 391, 337, 330, 334 cells. Data are represented as box-and-whisker plots where boxes correspond to the first to third quartiles, lines inside the boxes indicate the median, ends of whiskers and outliers follow a Tukey representation. Statistical analysis was performed using a two-sided Mann-Whitney U test (***P<0.001 (1st vs 2nd sample P = 3.65E-45; 2nd vs 5th sample P = 1.13E-45) ; ns, not significant). d, Fluorescence microscopy images of strain ColJIB. Cells with septal YFP-DivIB localisation but MurJ-mCherry still not at the septum (peripheral) are highlighted in insets i and ii, where the brightness of fluorescence signal was increased to allow visualisation of MurJ localisation. Scale bars, 1 μm. Images in (a, b, d) are representative of three biological replicates.

