
Extended Data Figure 1. Switching fluorescent tags has no effect on protein colocalisation data.
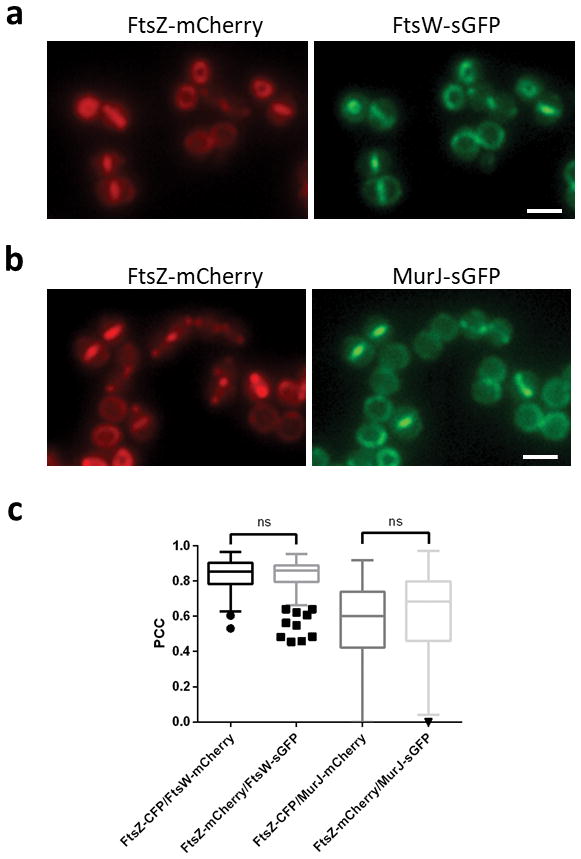
COL strains expressing FtsZ-mCherry/FtsW-sGFP (a) or FtsZ-mCherry/MurJ-sGFP (b) were compared to strains expressing FtsZ-CFP/FtsW-mCherry or FtsZ-CFP/MurJ-mCherry, respectively (described in Fig. 2b and c). Scale bars, 2 μm. c, Pearson’s correlation coefficient (PCC) values between fluorescence channels for each protein fusion pair were calculated for cells showing septal FtsZ localisation. From left to right, N=138, 136, 133, 139 cells. Negative PCC values are represented as 0. Data are represented as box-and-whisker plots where boxes correspond to the first to third quartiles, lines inside the boxes indicate the median and ends of whiskers and outliers follow a Tukey representation. Statistical analysis was performed using a two-sided Mann-Whitney U test (ns, not significant). Images in (a,b) are representative of three biological replicates.