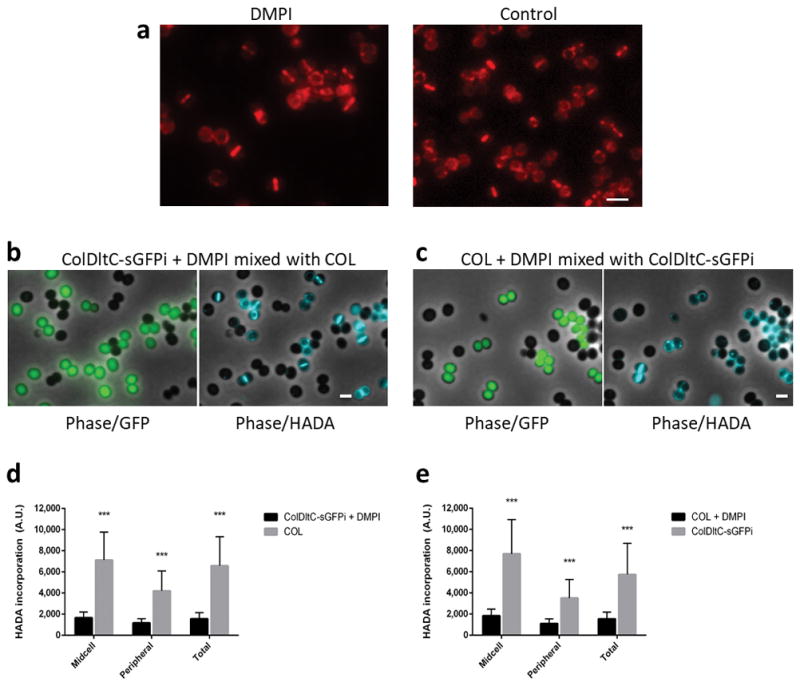
Extended Data Figure 4. Inhibition of MurJ activity does not prevent its recruitment to midcell but impairs PG synthesis.

a, Fluorescence microscopy images of ColMurJ-mCherry cells grown in the presence (left) or absence (right) of MurJ inhibitor DMPI for 30 minutes at 2X MIC. Scale bar, 2 μm. b,c Fluorescence microscopy images showing mixed cultures of either (b) DMPI-treated ColDltC-sGFPi cells mixed with COL cells or (c) DMPI-treated COL cells mixed with ColDltC-sGFPi cells, following incubation with HADA. The two cultures, which can be easily distinguished due to GFP expression in ColDltC-sGFPi, were mixed on the same slide to decrease fluorescence variation of HADA signal due to imaging conditions. Data shows that HADA incorporation (i.e. PG synthesis) is greatly reduced in the presence of DMPI. Phase contrast/GFP channel overlays are shown on the left and phase contrast/HADA channel overlays are shown on the right. Scale bars, 1 μm. d, e HADA fluorescence signal measured at the midcell (Midcell), the periphery (Peripheral) or over the entire cell (Total) of DMPI-treated ColDltC-sGFPi cells mixed with COL cells (d) or DMPI-treated COL cells mixed with ColDltC-sGFPi cells (e). Images in (a–c) are representative of three biological replicates. Data in (d,e) are represented as column plots (N=100 cells for each column) where the height of the column is the mean and the whiskers indicate standard deviation. Statistical analysis was performed using two-sided unpaired t-tests (***, P<0.001; panel d: P = 2.34E-38 for midcell; P = 1.81E-29 for peripheral; P = 9.22E-34 for total; panel e: P = 1.74E-33 for midcell; P = 8.77E-25 for peripheral; P = 7.60E-26 for total).
