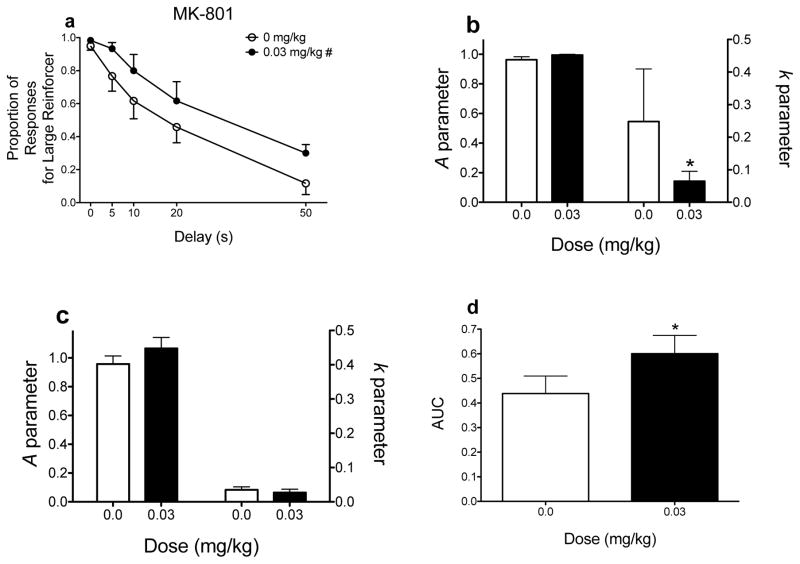
Figure 2.
Effects of MK-801 on delay discounting. (a) Mean (±SEM) raw proportion of responses for the large magnitude reinforcer as a function of delay. (b and c) Mean (±SEM) A and k parameter estimates derived from the hyperbolic discounting function. In panel b, the parameter estimates were derived and then subjected to a secondary analysis; in panel c, the parameter estimates were derived using nonlinear mixed effects modeling. (d) Mean (±SEM) AUC values. # indicates a main effect of dose only (p < .05). *p < .05, relative to vehicle. These graphs were derived from data previously published (Yates et al. 2015). Note, for simplicity, only the dose that produced statistically significant differences in performance is included.

