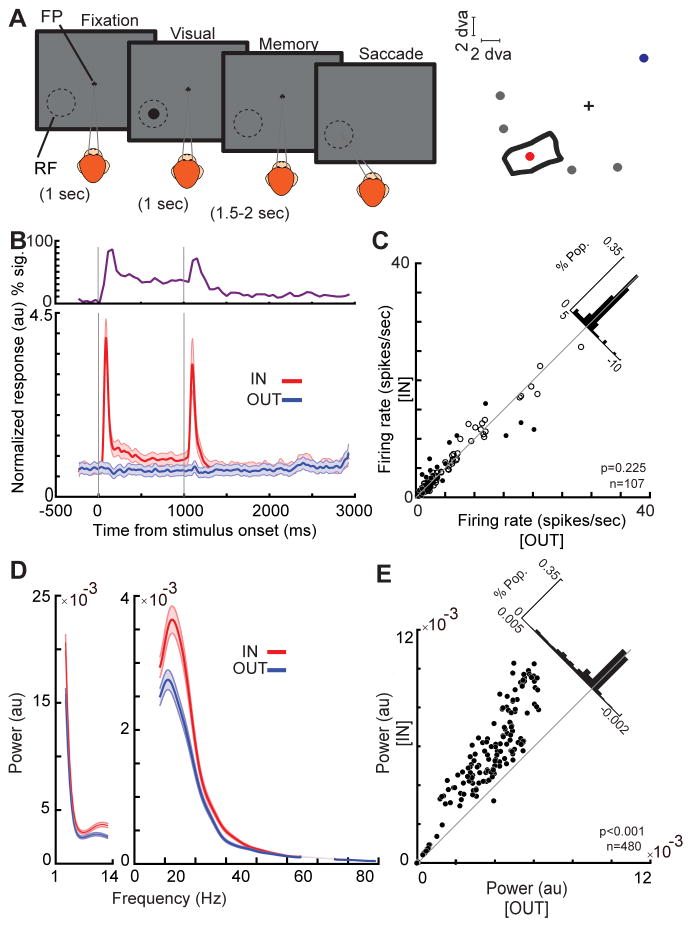
Figure 1. WM modulates LFP power in the αβ band.
A) Schematic of the MGS task. The monkey fixates on a central fixation point (FP), and a cue stimulus appears in one of six positions arranged around the neuron’s RF location (right). The cue stimulus disappears, and the monkey maintains fixation throughout a blank delay period. Following the disappearance of the fixation point, the monkey saccades to the remembered location to receive a reward. B) The bottom plot shows the normalized firing rate of 107 MT neurons across the course of the MGS task, when the memorized location is inside (IN, red) and outside (OUT, blue) of the neurons’ RFs. Data are smoothed within a window of 30 ms and represented as mean ± SEM. The upper plot shows the proportion of neurons showing a statistically significant increase in firing rate during the memory IN compared to the OUT condition at each point in time measured a bin size of 100 ms with step size of 50 ms. C) The scatter plot of raw firing rates during the last 500 ms of the memory period. Black dots show neurons with statistically significant changes in firing rate and empty circles show neurons with no significant firing rate modulation. The diagonal histogram shows the distribution of firing rate changes. D) The average LFP power spectrum during the memory period across frequencies (n=480 LFP recordings), for memory IN (red) and memory OUT (blue) condition. Shading shows the standard error across recorded LFP signals. E) The scatter plot of αβ power (8–25Hz) during memory IN vs. OUT. Black dots show LFP sites with a significant change in power, empty circles show LFP sites with no significant power modulation. The diagonal histogram shows the distribution of differences in αβ power for all LFPs. See also Figure S1.

