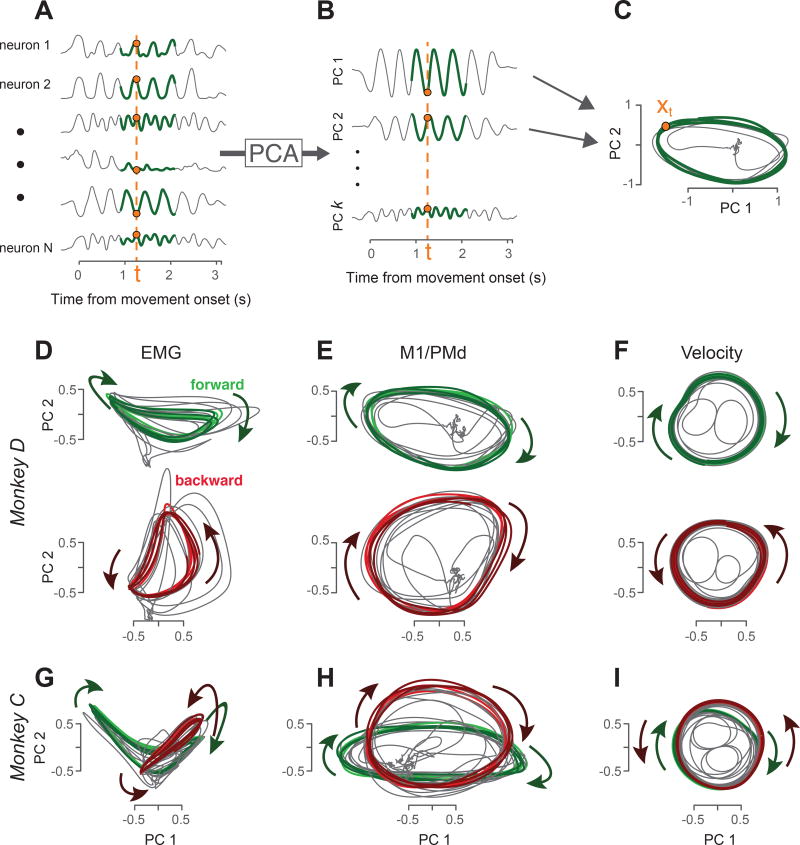
Figure 4.
Visualization of population structure via PCA. A. PCA operates on a population of responses (six of 103 neurons are shown, monkey D). Green traces highlight the middle three ‘steady state’ cycles, which were used to find the PCs for the present analyses (subsequent analyses consider all times for all conditions). Data are shown for only one condition – forward cycling starting at the bottom – but PCs were computed based on both forward and backward cycling and both top- and bottom-start conditions. B. Projections onto the PCs capture the dominant signals in the data. Orange dashed lines highlight the ‘neural state’ at a single time. That state can be summarized either using the full vector of firing rates (A) or a reduced-dimensional vector containing the values of the projections onto the top PCs (B). C. Neural trajectories revealed by plotting the projection onto the second PC versus the projection onto the first PC (~35% of the total variance is captured in these two dimensions). This is equivalent to projecting the 103-dimensional neural trajectory onto the two dimensions defined by the PCs. Orange dot corresponds to the neural state at the same time as in A and B. D. Muscle trajectories captured by projecting the muscle population response onto its first two PCs (monkey D). Trajectories are shown for forward cycling (green) and backward cycling (red). Each panel overlays trajectories for top-start and bottom-start conditions (lighter and darker colored traces respectively). The same PCs were used to project data for both forward and backward cycling. E. Corresponding neural trajectories for the same monkey and conditions as in D. F. Corresponding hand-velocity trajectories. Trajectories were produced by applying PCA to horizontal and hand velocity traces across multiple sessions. This is exceedingly similar (but for a change of axes) to simply plotting average vertical velocity versus average horizontal velocity. G,H,I. PCA-based muscle, neural, and velocity trajectories for monkey C. Same format as D,E,F, but forward and backward cycling are overlaid.

