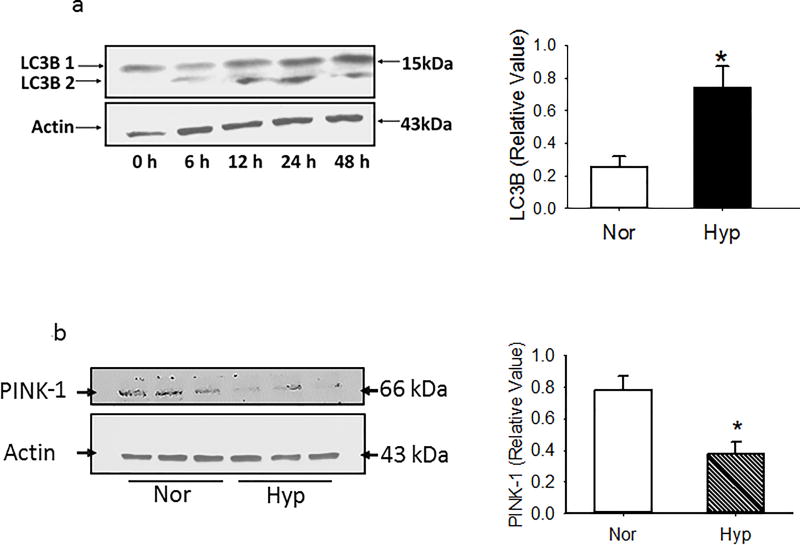
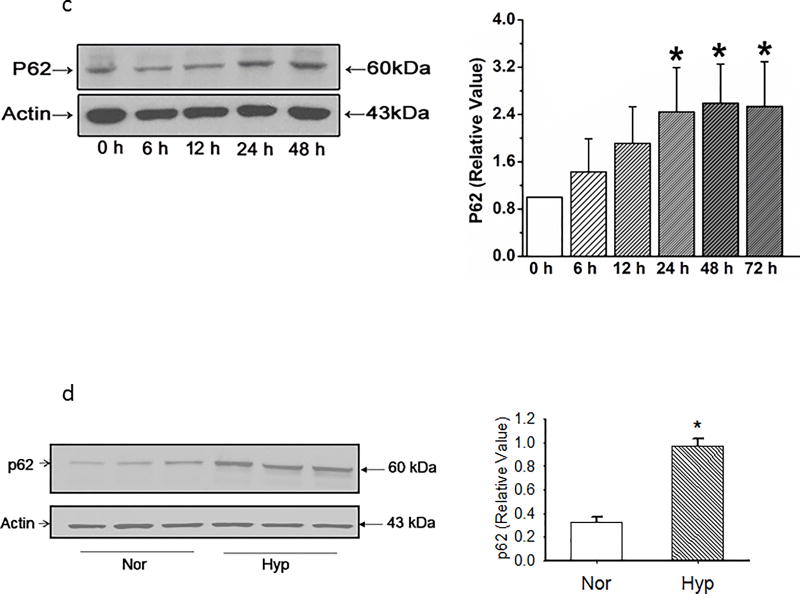
Figure 4.
(a). Representative and averaged data for normoxia and 48 hours show that LC3B 1/2 density relative to that of beta actin is increased by hyperoxia. N≥4 for each time point in graph. Data were normally distributed with equal variance and compared by t-test. *P < 0.01, different from normoxia.
(b). Representative and averaged data show that PINK-1 density relative to that of beta actin is decreased in PECs exposed for 48 hours to hyperoxia (n=7 each for normoxia and hyperoxia). Data were normally distributed with equal variance and compared by t-test. *P < 0.005, different from normoxia.
(c) Representative western blots and averaged band intensity showing p62 density normalized to beta actin in PECs. N=6 endothelial cell isolates for each time point. P62 density increased after 24 hours and remained elevated through 48 hours. Data were normally distributed with equal variance and compared by ANOVA. *P < 0.05, different from normoxia.
(d). Representative and averaged data show that p62 density relative to that of beta actin is increased in whole lung homogenates by 48 hours exposure of rats in vivo to hyperoxia (n=9 each for normoxia and hyperoxia). Data were normally distributed with equal variance and compared by t-test. *P < 0.001, different from normoxia.


