Figure 6.
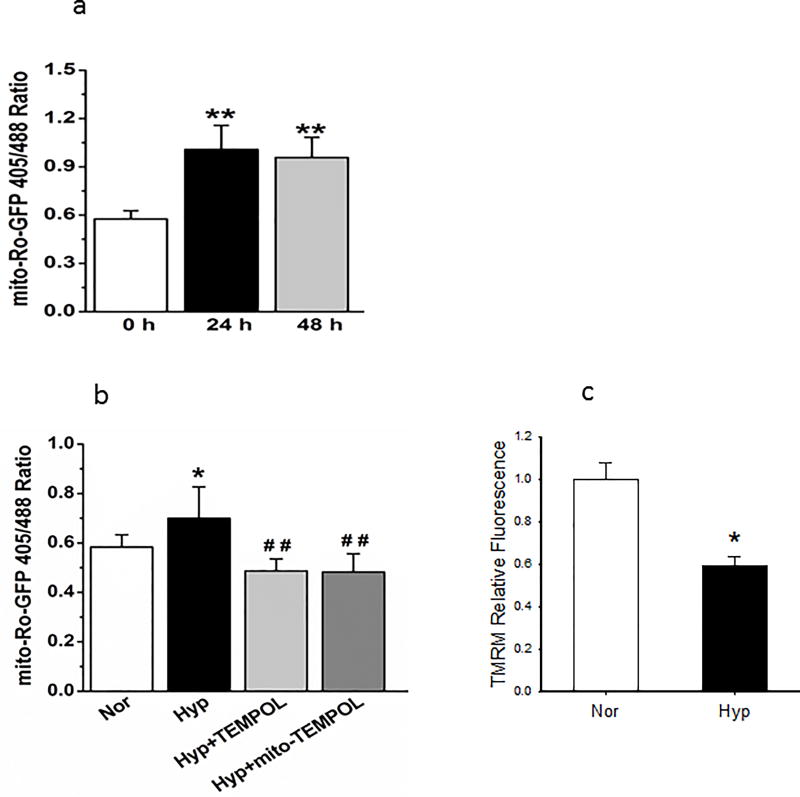
(a). We studies the oxidative status of cells infected with ro-GFP lentivirus based on the ratio of fluorescence at 405/488 nm. Oxidation was increased by 24 hours and remained elevated through 48 hours (n=5, 5 and 8 representative fields from 3 separate experiments for 0, 24, and 48 hours respectively). Data were not normally distributed and compared by ANOVA on Ranks. **P < 0.01, different from normoxia.
(b). Inclusion of TEMPOL or mito-TEMPOL (10 mM each) in incubation media for 48 hours during hyperoxia prevented the increase in oxidation as quantified by the ro-GFP fluorescence ratio 405/488. N=5 fields/condition, from 3 separate experiments. Data were not normally distributed and compared by ANOVA on Ranks. *P < 0.05; ##P < 0.01, different from hyperoxia.
(c). After incubation for 48 hours in normoxia or hypoxia, PECs were washed with PBS, then loaded with a final concentration of 100 nM TMRM. TMRM fluorescence in images of cells from hyperoxic and normoxic environments were compared in order to assess for relative mitochondrial polarization. N=9 representative fields each from normoxic and hyperoxic cells from 2 separate isolations. Data passed normality and equal variance tests and were compared by ANOVA. *=p<0.001 relative to normoxia.

