Figure 7.
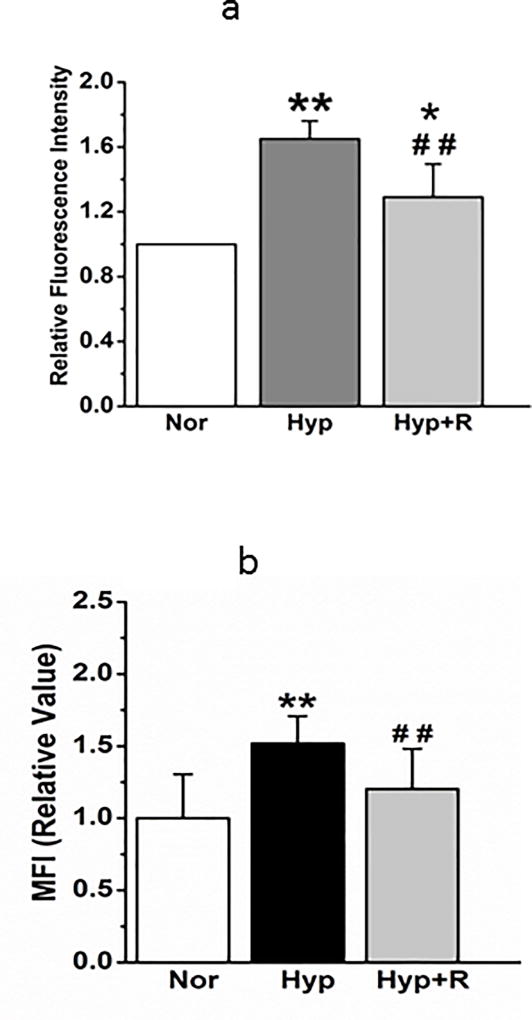
(a). Mito-SOX fluorescence, which is increased 48 hours after hyperoxia, then decreases after 24 hours in normoxia (n=6 representative fields of cells for each condition, from 3 separate experiments). Data passed normality and equal variance tests and were compared by ANOVA. *P < 0.05, different from normoxia; **P < 0.01, different from normoxia, ##P < 0.01, different from hyperoxia.
(b) Averaged MFI show that increased mitochondrial fragmentation is resolved after 24 hours back in normoxia (N=18, 11, and 17 cells from 3 experiments). Data passed normality and equal variance tests and were compared by ANOVA. **P < 0.01, different from normoxia, ##P < 0.01, different from hyperoxia.
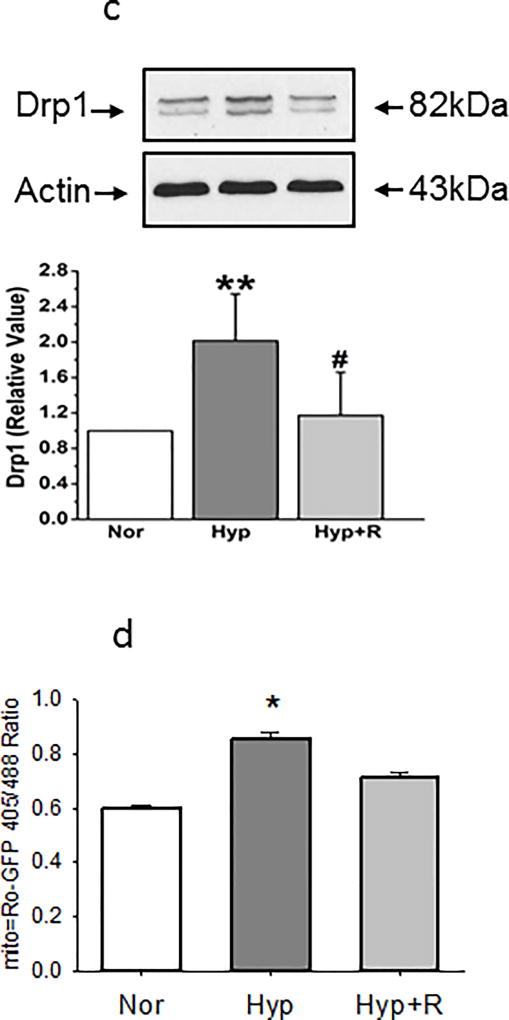
(c). Representative and averaged data show that Drp-1 density relative to that of beta actin is increased by 48 hours hyperoxia, but recovered to baseline within 24 hours in normoxia (n=11 for each condition). Data were not normally distributed and compared by ANOVA on Ranks. **P < 0.01, different from normoxia, #P < 0.05; #P < 0.01, different from hyperoxia.
(d). Oxidative status of cells infected with roGFP based on the ratio of fluorescence at 405/488 nm is increased by 48 hours hyperoxia (Hyp) and partially recovered after 24 hours back in normoxia (Hyp + R). N=5–8 fields/condition, from 3 separate experiments. Data failed equal variance test and were compared by ANOVA on Ranks. *=p<0.01 relative to normoxia.


