Figure 2.
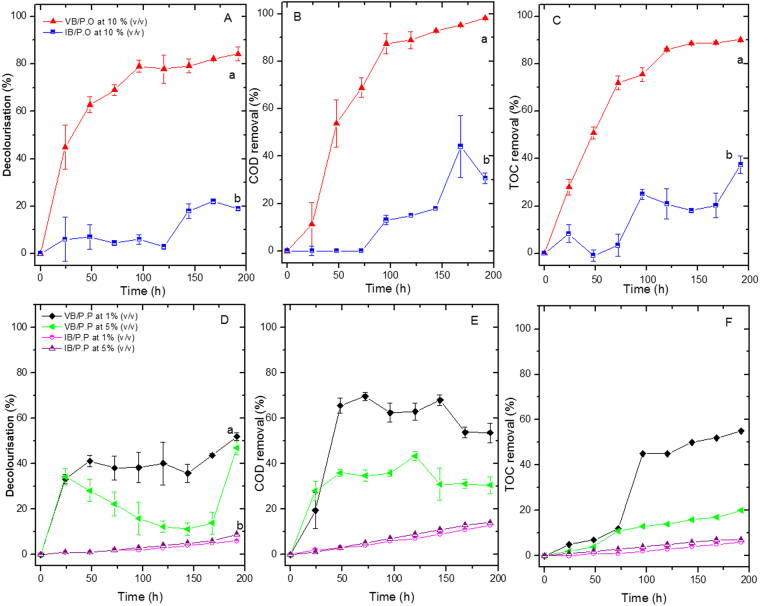
P. ostreatus viable biomass (VB/P.O) and inactive biomass (IB/P.O) removal curves. (A) Decolourisation. (B) COD removal. (C) TOC removal. P. pastoris viable biomass (VB/P.P) and inactive biomass (IB/P.P) removal curves. (D) Decolourisation. (E) COD removal. (F) TOC removal. For all cases, after 192 h of treatment, significant differences were observed between VB/P.O and IB/P.O, (p < 0.0001), with decolourisation values of 84 and 19% and COD removal of 90 and 37%, respectively. For P. pastoris, VB removal percentages for 5 and 1% SBL increased gradually with time, with higher values for VB than for IB. Decolourisation values of 47.5 and 52% were observed, along with COD removal of 30 and 53% and TOC removal of 20 and 55%. Lower values were observed for IB: 9 and 6.3% for decolourisation, 14 and 13% for COD removal and less than 10% for TOC. The letters represent heterogeneous groups obtained after Tukey test analysis. The letter a corresponds to the best treatment, followed by the letter b. The bars represent the Mean ± SD (n = 3) for consistency.

