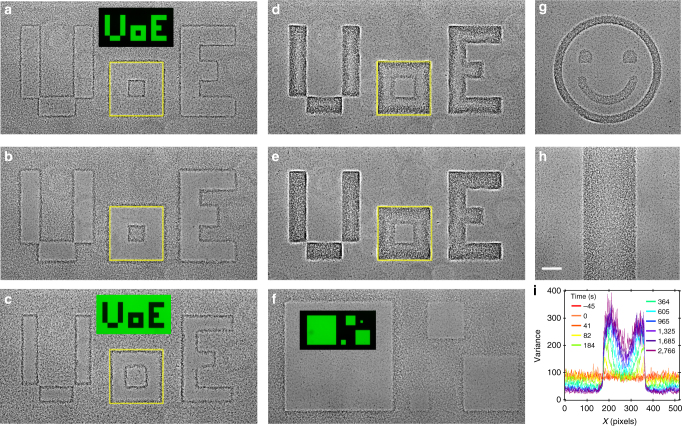
Fig. 2.
Smart templated active self-assembly. Positive and negative masks projected onto initially stationary cells: a sample illuminated for 1 min with a positive ‘UoE’ (University of Edinburgh) pattern shown in inset, b same after 9 min of illumination, c 1 min after switching to the negative pattern shown in inset (with green = bright), as well as d 6 min and e 12 min after switching. Yellow square = boundary between light and dark regions of the ‘o’. f Samples illuminated with pattern of squares shown in inset. g Negative smiley pattern. h Negative strip together with i time evolution of the strip’s density profile. Scale bar in h is 100 μm and applies throughout

