Figure 2.
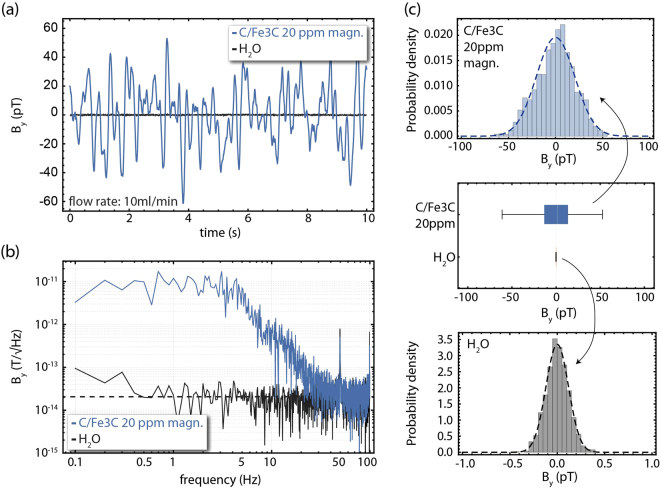
Detection of C/Fe3C ferromagnetic particles in water solutions. (a) Real time magnetic-field measurements along the y-axis for pure water (black points) and 20 ppm:water solution of pre-magnetized C/Fe3C nanoparticles (blue points). (b) Magnetic field power spectra for the measurements presented in (a). The black dashed line corresponds to 20.4 fT/ (averaged from 1–100 Hz), indicating the noise floor baseline of the measurement and verifying that the presence of the water does not influence significantly the magnetometer’s sensitivity. (c) Histogram analysis of the measurements shown in (a) and (b), including a box-and-whisker plot analysis for visual comparison of the observed magnetic-field distributions (the white line represents the median marker, the grey boxes the upper and lower 25% quantiles, while the grey bars represent the maximum and minimum acquired data points, including data outliers). For the histogram analysis we employ a digital filter to remove the 50 Hz and 100 Hz power-line-related noise components. All measurements are performed under constant flow conditions, with a flow rate of 10 ml/min.

