Fig. 1.
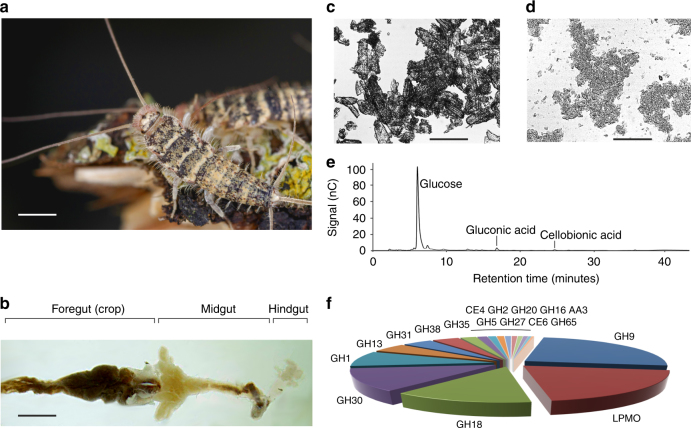
Discovery of the AA15 LPMO family in T. domestica. (a) Photograph of live specimens of T. domestica in their natural environment. Scale bar, 300 µm. (b) Dissected gut of T. domestica. The crop represents the largest portion of the foregut and the organ where food particles and digestive enzymes accumulate. Scale bar, 100 µm. (c) Microscopic image of Avicel (microcrystalline cellulose). Average particle size is ~50 µm. Scale bar, 30 µm. (d) Microscopic image of food pellet collected from the crop of T. domestica fed on Avicel. Particle size is greatly reduced to ~5 µm. Scale bar, 30 µm. (e) HPAEC analysis of soluble extract isolated from the crop of T. domestica grown on Avicel. One dominant peak corresponding to glucose is clearly visible, plus minor peaks for gluconic acid and cellobionic acid. The identity of the peaks was determined by analyzing commercial standards. (f) Pie chart summary of the CAZymes identified in the crop of T. domestica grown on Avicel. Abundance values for the various families were calculated as molar percentage from emPAI values obtained from shotgun proteomics data (GH9 24.6%, LPMO 20.2%, GH18 13.2%, GH30 12.3%, GH1 8.4%, GH13 4.7%, GH31 4.0%, GH38 3.6%, GH35 2.1%, CE4 1.3%, GH2 1.1%, GH20 1.0%, GH16 0.8%, AA3 0.7%, GH5 0.7%, GH27 0.6%, CE6 0.4%, GH65 0.3 %). See Methods for more details

