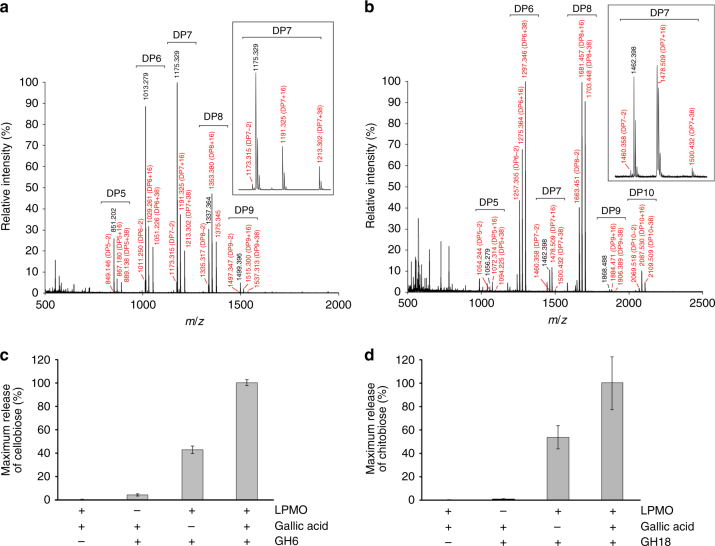
Fig. 3.
Biochemical characterization of TdAA15A. MALDI-TOF MS spectrum of products obtained after incubation of 4 mg mL−1 microcrystalline cellulose (a) or β-chitin (b) with 2 µM TdAA15A and 4 mM gallic acid for 24 h, showing native and oxidized oligosaccharides. For both substrates, the main peaks correspond to mono- or di-sodiated adducts of C1-aldonic acids, imparting +16 or +38 m/z respectively, relative to the mono-sodiated unoxidized form. Smaller peaks for the mono-sodiated lactone (−2) were also identified. All oxidized species are marked in red. For chitin, the products released seem to be predominantly even-numbered oligosaccharides, implying that the enzyme can attack the crystalline structure, as previously observed for other LPMOs2. In a and b, 100% relative intensity represents 0.9 × 10⁴ and 1.0 × 10⁴ arbitrary units (a.u.), respectively. Negative control reactions carried out with substrate only, substrate plus gallic acid, and substrate plus TdAA15A did not generate any oxidized products (see Supplementary Fig. 6a–d). Insets are expanded mass spectra for DP7 products. c Relative product quantification, showing release of cellobiose from microcrystalline cellulose by a commercial GH6. The LMPO significantly boosts the activity of the GH6, and such effect is increased by addition of 1 mM gallic acid. d Relative product quantification, showing release of chitobiose from β-chitin by a commercial chitinase. The LPMO boosts the activity of the chitinase, and the synergy is further enhanced by the presence of 1 mM gallic acid. All boosting experiments were carried out over 3 h at 28 °C and products quantified by HPAEC. Bars indicate means (error bars: standard deviations of three replicates). The identity and quantity of each species was determined by analysis of commercial standards. See Methods for more details

