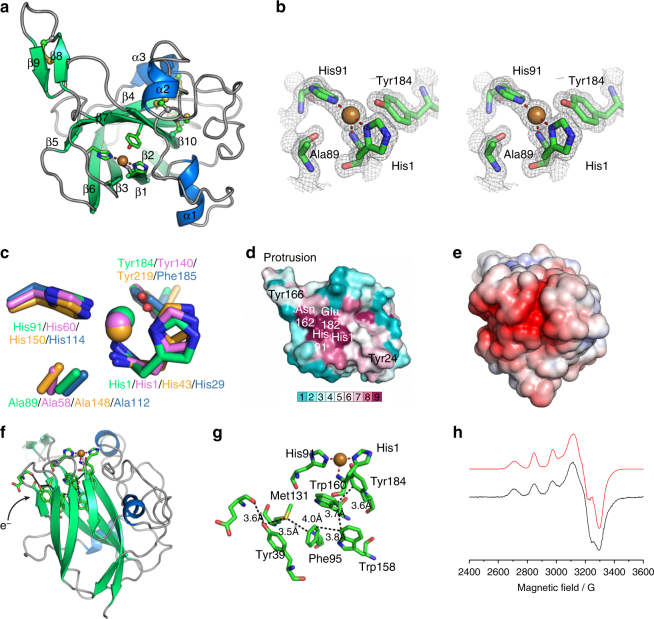
Fig. 4.
Structural and spectroscopic characterization of TdAA15A. a The overall structure of TdAA15A is shown colored by secondary structure. The protrusion formed by strands β8 and β9 is clearly shown extending the surface surrounding the active site. Disulfide bonds are shown in ball and stick with sulfur atoms colored yellow. b Stereo view of the electron density observed at the copper active site of TdAA15A (2mFo-Fc map contoured at 1σ). The histidine brace coordination of the copper, which is in the Cu(I) state due to photoreduction in the X-ray beam, is shown by red dashed lines. The copper ion is shown as a golden colored sphere. c The active site of TdAA15A (green) was superposed with equivalent residues from AoAA113 (pdb 4mai, violet, a C1 specific chitin active LPMO), ScLPMO10B68 (pdb 4oy6, orange, an LPMO with both C1 and C4 oxidizing activity on cellulose, and C1 oxidizing activity on chitin), and EfAA1069 (pdb 4als, blue, a chitin active C1 specific LPMO) giving rmsds of 0.71 Å over 37 atoms, 1.13 Å over 37 atoms, and 0.59 Å over 37 atoms, respectively. The axial alanine in the chitin active EfAA10 superposes closely with Ala 89 from TdAA15A while the equivalent alanines in AoAA11 and ScLPMO10B do not occupy the same position. d Sequence conservation analysis (ConSurf) of TdAA15A looking down on the active site. The surface is colored by ConSurf score according to the indicated scoring scheme. The conserved residues in the active site are labeled along with the protrusion and surface exposed tyrosines (Tyr166 and Tyr24). e Electrostatic surface potential of TdAA15A showing the large negatively charged patch (red) present on the protein surface that could be a docking site for a protein partner. The APBS plugin for PyMol was used to calculate and visualize the surface electrostatic potential at ±5 KBT/e. f Cartoon representation of TdAA15A in the same orientation as the electrostatic surface potential diagram in e. The possible entry point for electrons is indicated and the potential electron transferring residues are shown as sticks colored by atom type. g Potential electron wire through the protein core. The shortest distances between atoms in each residue are shown by black dashed lines. h Continuous wave X-band EPR spectrum (9.3 GHz, 160 K) with simulation (red) of TdAA15A in sodium phosphate buffer pH 7 and 10% v/v glycerol. Simulations were obtained with 15% of species 1, see Supplementary Table 3 for more details

