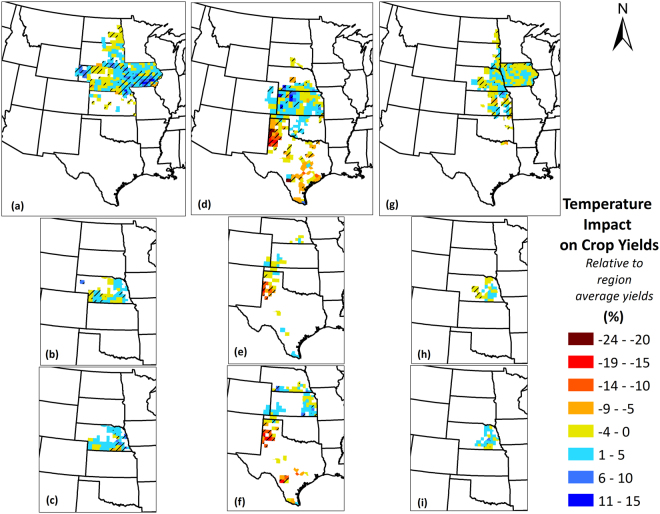
Figure 10.
Temperature-induced crop yield impacts for (a) Maize; (b) Irrigated maize; (c) Non-irrigated maize; (d) Sorghum; (e) Irrigated sorghum; (f) Non-irrigated sorghum; (g) Soybean; (h) Irrigated soybean; (i) Non-irrigated soybean yields in the Great Plains counties over the period 1968–2013. Values are represented as percentage of region-average yields. A positive sign indicates that the observed trends in temperature whether increasing or decreasing, have positively impacted crop yields, while a negative sign indicates that observed trends in temperature have negatively impacted crop yields. Counties with striped lines indicate that the temperature-induced impacts were statistically significant at 90% confidence level. We created the maps using ESRI ArcMap 10.4.1 software http://desktop.arcgis.com/en/arcmap/.

