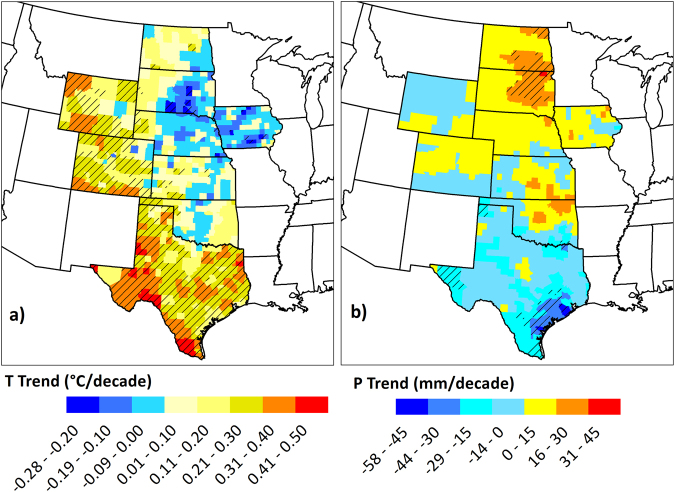
Figure 4.
Trends in growing season (May 1st to September 30th) (a) Average Air Temperature (b) Precipitation totals in the Great Plains counties over the period 1968–2013. Temperature trends are represented in °C decade−1 and precipitation trends are represented in mm decade−1. Counties with striped lines indicate that the trend in the county was statistically significant to 95% confidence level. We created the maps using ESRI ArcMap 10.4.1 software http://desktop.arcgis.com/en/arcmap/.

