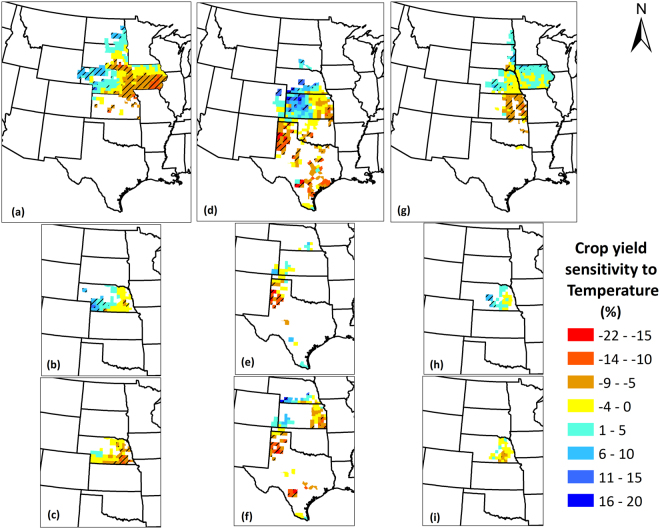
Figure 8.
Crop yield sensitivity to temperature for (a) Maize; (b) Irrigated maize; (c) Non-irrigated maize; (d) Sorghum; (e) Irrigated sorghum; (f) Non-irrigated sorghum; (g) Soybean; (h) Irrigated soybean; (i) Non-irrigated soybean yields in the Great Plains counties over the period 1968–2013. The value represents change in crop yields as percentage of mean crop yields over 1968–2013 per 1 °C increase in temperature. Negative values indicate that the crop yields decrease with temperature rise and positive values indicate that they increase with temperature rise. Counties with striped lines indicate that the sensitivity magnitudes were statistically significant at 90% confidence level. We created the maps using ESRI ArcMap 10.4.1 software http://desktop.arcgis.com/en/arcmap/.

