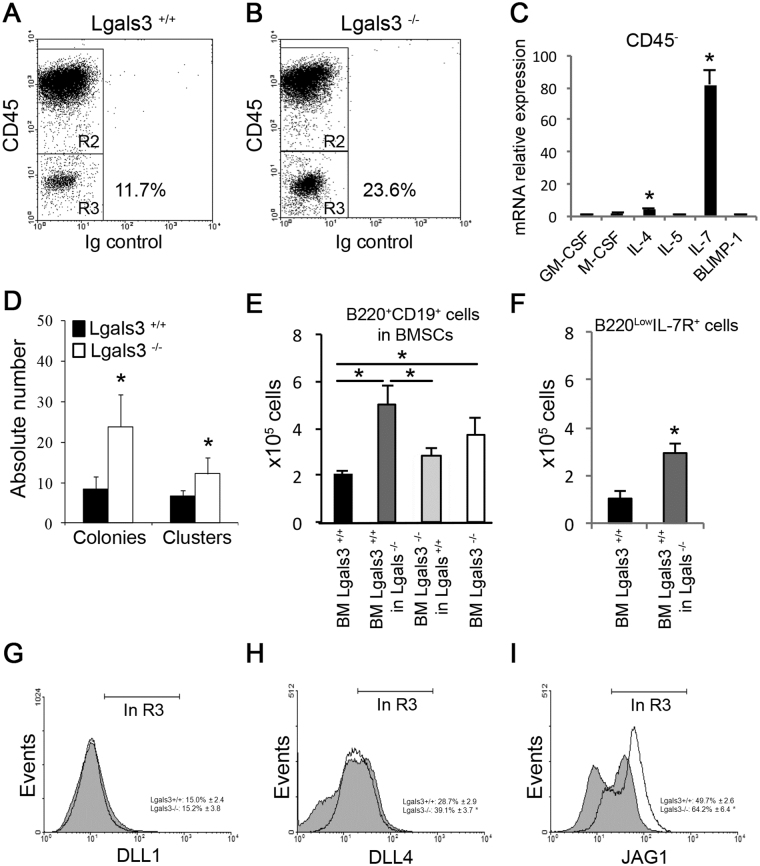
Figure 2.
Characterization of bone marrow stromal cells (BMSCs). CD45− BMSCs (gate R3) of Lgals3+/+ (A) and Lgals3−/− mice (B). (C) The relative expression of genes involved with hematopoietic events was compared between CD45− BMSCs of Lgals3+/+ and Lgals3−/− mice (Lgals3−/− per Lgals3+/+). (D) Total bone marrow cells were cultured in the methylcellulose system containing B cell-enriched growth factors: colonies (maximum 50 cells) and clusters (minimum 50 cells). (E) Coculture systems using different strategies to quantify B220+CD19+ B cells: BM Lgals3+/+ (culture of total bone marrow cells of Lgals3+/+); BM Lgals3+/+ in Lgals3−/− (bone marrow cells of Lgals3+/+ mice cultured in BMSCs of Lgals3−/−); BM Lgals3−/− in Lgals3+/+ (bone marrow cells of Lgals3−/− cultured in Lgals3+/+ BMSCs); BM Lgals3−/− (culture of total bone marrow cells of Lgals3+/+). (F) Number of B220lowIL-7R+ cells after 1 week using similar co-culture strategy. (G–I) Histograms represent the expression of Delta-like 1 (DLL1), Delta-like 4 (DLL4) and Jagged-1 (JAG1) by CD45− BMSCs (gated in R3, A and B). n = 5 mice per group. (*) Indicates p < 0.05. Dot plot graphs are representative of each mice group.

