Figure 5.
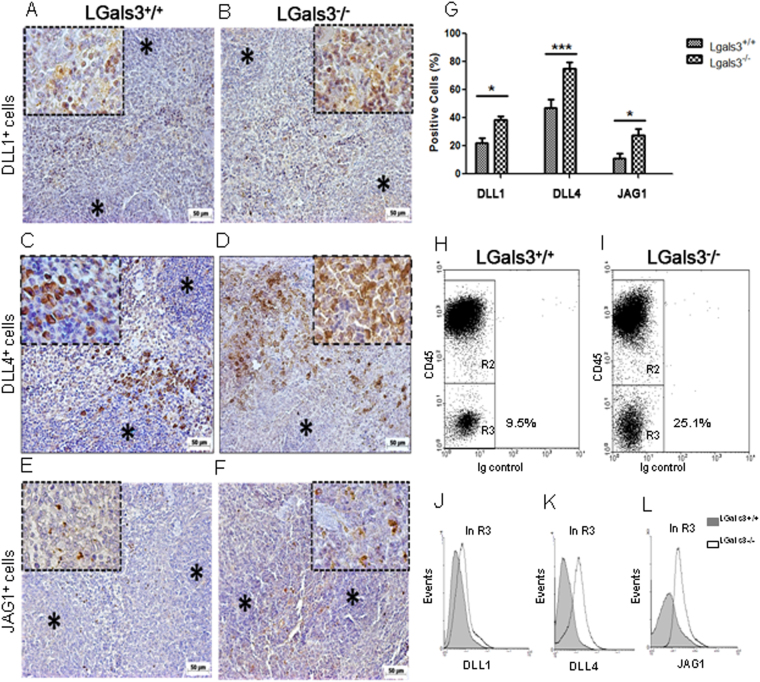
Localization of Notch-ligands expressing cells in the spleen. (A) DLL1+ cells in extrafollicular sites of Lgals3+/+ mice. (B) DLL1+ cells atypically distributed on Lgals3−/− mice. (C) DLL4+ cells in well defined sites in Lgals3+/+ mice and (D) disorganized in Lgals3−/− mice. (E) JAG1+ cells on extrafollicular regions of Lgals3+/+ mice and randomly distributed in Lgals3−/− mice (F). (G) Percentage of splenic cells according positivity to DLL1, DLL4 and JAG1. Dot plot graphs by flow cytometry identify hematopoietic (CD45+) cells and stromal (CD45−) cells in both Lgals3+/+ and Lgals3−/− mice (H and I, in R3, respectively). Histograms indicate the intensity of expression of DLL1 (J), DLL4 (K) and JAG1 (L) in both groups of mice. n = 5 mice per group. Magnification: (A–F) 100×; inserts 400×; DLL1 = Delta-like 1, DLL4 = Delta-like 4 and JAG1 = Jagged-1. (*) Indicates p < 0.05. (***) Indicates p < 0.01.

