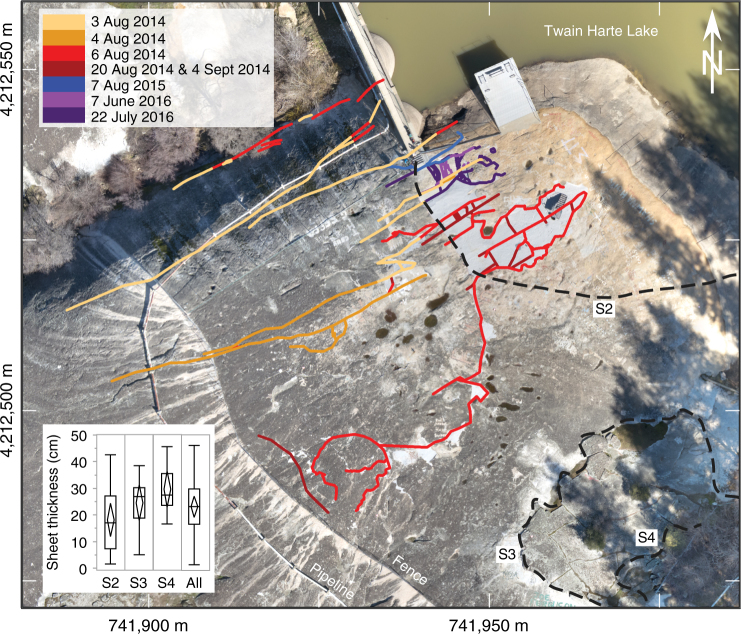
Fig. 2.
Fracture mapping of recent and older exfoliation at Twain Harte Dome. Fractures (both surface-parallel and perpendicular) formed during events of 2014–2016—colored by date—indicate exfoliation progressed first to the south and then to the northeast. Mean thickness (inset), measured along transects (dashed lines—S3, S4), of past exfoliation sheets is slightly larger than the mean thickness of newly exposed sheets on the dome surface (S2), reflecting that thinner sheets formed during recent exfoliation and have eroded from older generations. Note that the top of sheet S1 (not labeled) is formed by the newly exposed exfoliation surface; its thickness across a transect cannot be easily measured. Base image (NAD83, UTM Zone 10 grid shown) created from UAS (drone) orthophotography as part of this study. Inset box-and-whisker plot elements: horizontal line = median; diamond = mean (center) and 95% confidence interval; box = 25th to 75th quantiles; whiskers = all data range

