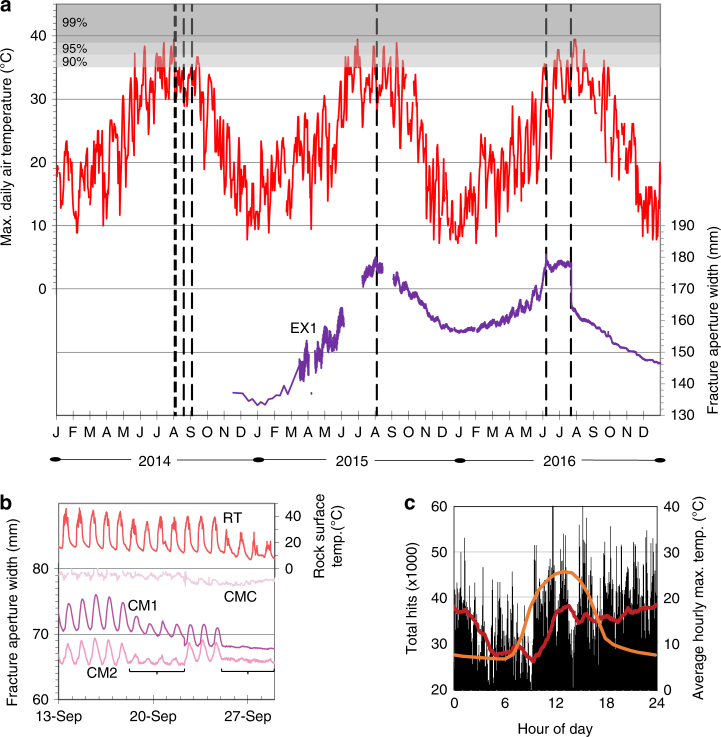
Fig. 4.
Time scales of critical and subcritical exfoliation fracture propagation. a Sheet deformation (EX1) correlates with maximum daily temperature with shaded quantiles indicating that all fracturing events (vertical dashed lines) occurred within 10-day time periods containing the hottest 10% of all days during the past 110 years. Initial fracture in 2014 occurred within 24 h of temperatures reaching the 99th percentile of hottest days on record. b Following cyclic diurnal fracture growth (CM1 and CM2), one exfoliation sheet collapsed (brackets) in 2014. Control signal (CMC) indicates small overall error (1 mm) compared to the sheet signals. c Total acoustic emission hits (n = 48.7 × 10⁶) from six sensors (Fig. 1c) over 6 months (October 2014–March 2015) indicate subcritical cracking was ongoing following the 2014 events; sharp increase in 3-h hit running average (red line) peaks with maximum temperatures (orange line)

