Fig. 2.
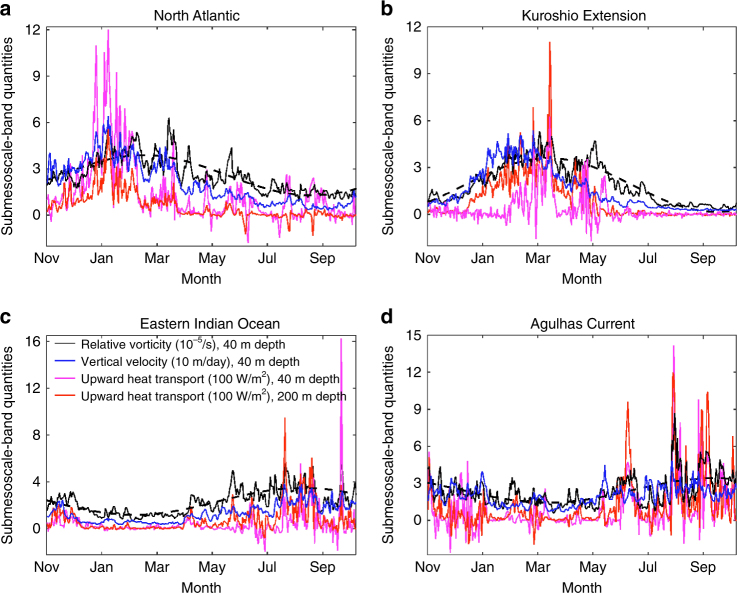
Temporal variability of submesoscale characteristics. Local time series of submesoscale band (~10–50 km, see “Methods”) root mean square (rms) relative vorticity (black), rms vertical velocity (blue), and vertical heat transport (positive: upward) at 40 m and 200 m depths (magenta and red, respectively). Dashed curves are the sinusoidal seasonal cycle fit for relative vorticity. The locations are in the a high-latitude North Atlantic (57°N, 26°W), b Kuroshio Extension (38.1°N, 156°E), c eastern Indian Ocean (38.3°S, 118°E), d Agulhas Current (40°S, 18°E). The results here are averaged over a 1° × 1° square box in each location. The correlation between the time series suggests a strong dynamic connection between the different quantities. Submesoscale upward heat transport can reach a significant amplitude up to 500–1000 W/m2, consistent with values inferred from recent observations10, and is characterized by a strong intermittency (days to weeks) and a winter-peaked seasonality

